
Its Day 60 of my 100 Days of Cloud journey, and todays post is all about Azure Monitor.
Azure Monitor is a solution for collecting, analyzing, and acting on telemetry from your cloud and on-premises environments. The information collected by Azure Monitor helps you understand how your resources in both Azure, On-Premise (via Azure Arc) and Multi-Cloud (via Azure Arc) environments are performing, and proactively identify issues affecting them and the resources they depend on.
Overview
The following diagram gives a high-level view of Azure Monitor:

We can see on the left of the diagram the Data Sources that Azure Monitor will collect data from. Azure Monitor can collect data from the following:
- Application monitoring data: Data about the performance and functionality of the code you have written, regardless of its platform.
- Guest OS monitoring data: Data about the operating system on which your application is running. This could be running in Azure, another cloud, or on-premises.
- Azure resource monitoring data: Data about the operation of an Azure resource.
- Azure subscription monitoring data: Data about the operation and management of an Azure subscription, as well as data about the health and operation of Azure itself.
- Azure tenant monitoring data: Data about the operation of tenant-level Azure services, such as Azure Active Directory.
In the center, we then have Metrics and Logs. This is the raw data that has been collected:
- Metrics are numerical values that describe some aspect of a system at a particular point in time. They are lightweight and capable of supporting near real-time scenarios.
- Logs contain different kinds of data organized into records with different sets of properties for each type. Telemetry such as events and traces are stored as logs in addition to performance data so that it can all be combined for analysis.
Finally, on the right hand side we our insights, visualizations. Having all of that monitoring data is no use to us if we’re not doing anything with it. Azure Monitor allows us to create customized monitoring experiences for a particular service or set of services. Examples of this are:
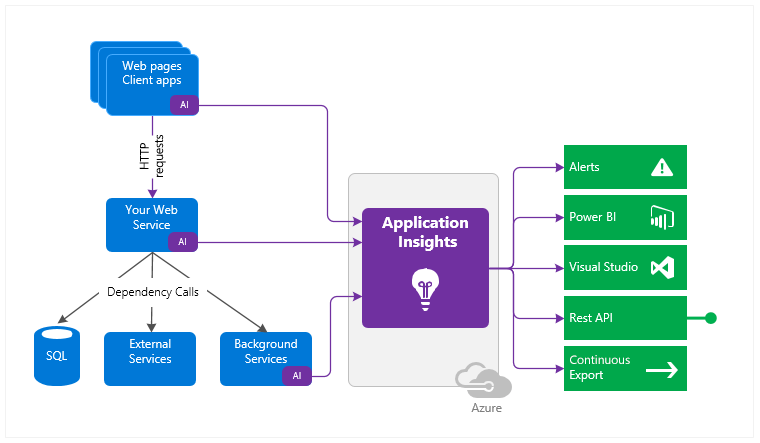
- Application Insights: Application Insights monitors the availability, performance, and usage of your web applications whether they’re hosted in the cloud or on-premises. It leverages the powerful data analysis platform in Azure Monitor to provide you with deep insights into your application’s operations. It enables you to diagnose errors without waiting for a user to report them.
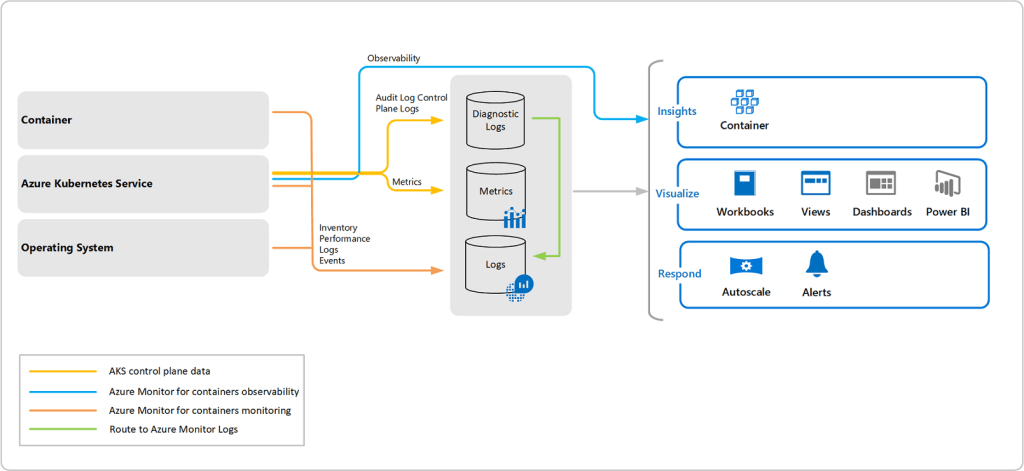
- Container Insights: Container Insights monitors the performance of container workloads that are deployed to managed Kubernetes clusters hosted on Azure Kubernetes Service (AKS) and Azure Container Instances. It gives you performance visibility by collecting metrics from controllers, nodes, and containers that are available in Kubernetes through the Metrics API. Container logs are also collected.
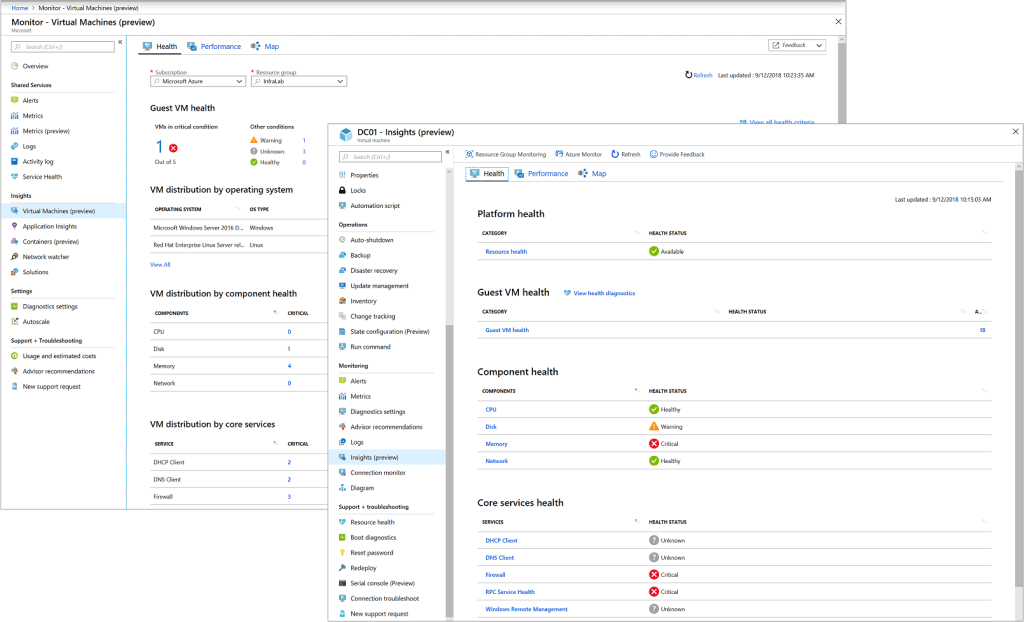
- VM Insights: VM Insights monitors your Azure virtual machines (VM) at scale. It analyzes the performance and health of your Windows and Linux VMs and identifies their different processes and interconnected dependencies on external processes.
Responding to Situations
Dashboards are pretty and we can get pretty dashboards with any monitoring solution in the market. But what if we could so something more with the data than just showing it in a dashboard? Well we can!!
- Alerts – Alerts in Azure Monitor proactively notify you of critical conditions and potentially attempt to take corrective action. Alert rules based on metrics provide near real time alerts based on numeric values. Rules based on logs allow for complex logic across data from multiple sources.

- Autoscale – Autoscale allows you to have the right amount of resources running to handle the load on your application. Create rules that use metrics collected by Azure Monitor to determine when to automatically add resources when load increases. Save money by removing resources that are sitting idle. You specify a minimum and maximum number of instances and the logic for when to increase or decrease resources.

- Dashboards – OK, so here’s the pretty dashboards! Azure dashboards allow you to combine different kinds of data into a single pane in the Azure portal. You can add the output of any log query or metrics chart to an Azure dashboard.

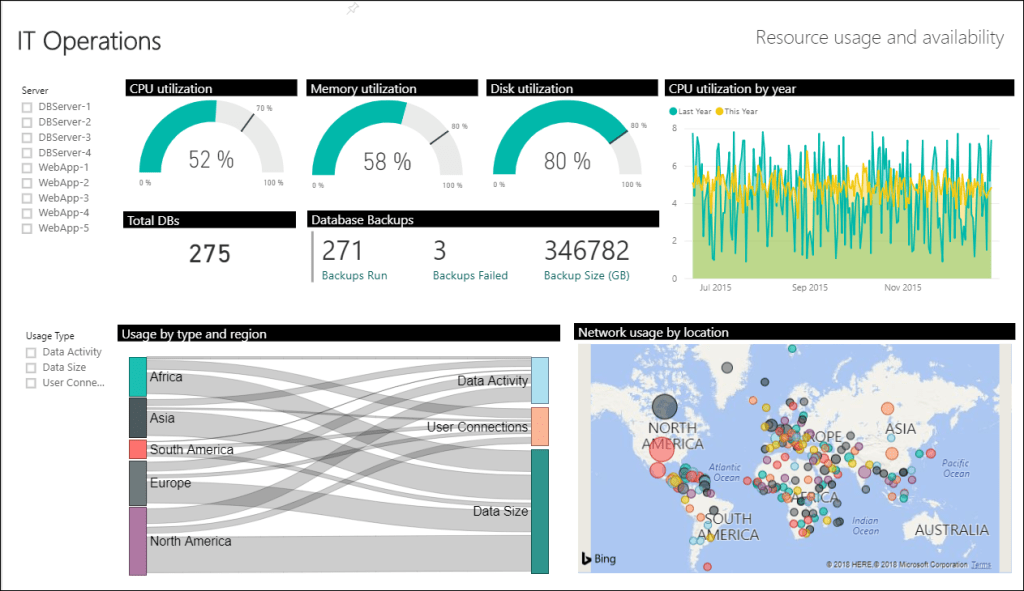
- PowerBI – And here’s some even prettier dashboards! You can configure PowerBI to automatically import data from Azure Monitor and take advantage of the business analytics service to provide dashboards from a variety of sources.
External Integration
We can also integrate Azure Monitor with other systems to build custom solutions that use your monitoring data. Other Azure services work with Azure Monitor to provide this integration:
- Azure Event Hubs is a streaming platform and event ingestion service. It can transform and store data using any real-time analytics provider or batching/storage adapters. Use Event Hubs to stream Azure Monitor data to partner SIEM and monitoring tools.
- Logic Apps is a service that allows you to automate tasks and business processes using workflows that integrate with different systems and services. Activities are available that read and write metrics and logs in Azure Monitor. This allows you to build workflows integrating with a variety of other systems.
- Multiple APIs are available to read and write metrics and logs to and from Azure Monitor in addition to accessing generated alerts. You can also configure and retrieve alerts. This provides you with essentially unlimited possibilities to build custom solutions that integrate with Azure Monitor.
Conclusion
And thats a brief overview of Azure Monitor, we can see how powerful a tool it can be to not just collect and monitor your event logs and metrics, but also to take actions based on limits that you set.
You can find more detailed information in the Microsoft Documentation here, and you can also find best practise guidance for monitoring in the Azure Architecture Center here. Hope you enjoyed this post, until next time!
