
Its Day 61 of my 100 Days of Cloud journey, and today I’m continuing to look at Azure Monitor, and am going to dig deeper into Azure Monitor Metrics and Azure Monitor Logs.
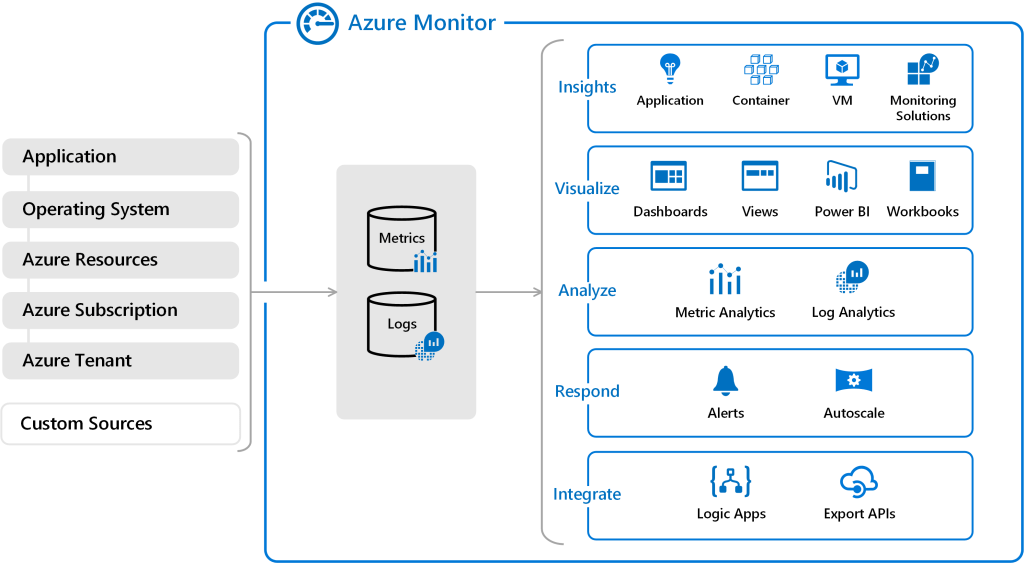
In our high level overview diagram, we saw that Metrics and Logs are the Raw Data that has been collected from the data sources.
Lets take a quick look at both options and what they are used for, as that will give us an insight into why we need both of them!
Azure Monitor Metrics
Azure Monitor Metrics collects data from monitored resources and stores the data in a time series database (for an OpenSource equivalent, think InfluxDB). Metrics are numerical values that are collected at regular intervals and describe some aspect of a system at a particular time.
Each set of metric values is a time series with the following properties:
- The time that the value was collected.
- The resource that the value is associated with.
- A namespace that acts like a category for the metric.
- A metric name.
- The value itself.
Once our metrics are collected, there are a number of options we have for using them, including:
- Analyze – Use Metrics Explorer to analyze collected metrics on a chart and compare metrics from various resources.
- Alert – Configure a metric alert rule that sends a notification or takes automated action when the metric value crosses a threshold.
- Visualize – Pin a chart from Metrics Explorer to an Azure dashboard, or export the results of a query to Grafana to use its dashboarding and combine with other data sources.
- Automate – Increase or decrease resources based on a metric value crossing a threshold.
- Export – Route metrics to logs to analyze data in Azure Monitor Metrics together with data in Azure Monitor Logs and to store metric values for longer than 93 days.
- Archive – Archive the performance or health history of your resource for compliance, auditing, or offline reporting purposes.
Azure Monitor can collect metrics from a number of sources:
- Azure Resources – gives visibility into their health and performance over a period of time.
- Applications – detect performance issues and track trends in how the application is being used.
- Virtual Machine Agents – collect guest OS metrics from Windows or Linux VMs.
- Custom Metrics can also be defined for an app thats monitored by Application Insights.
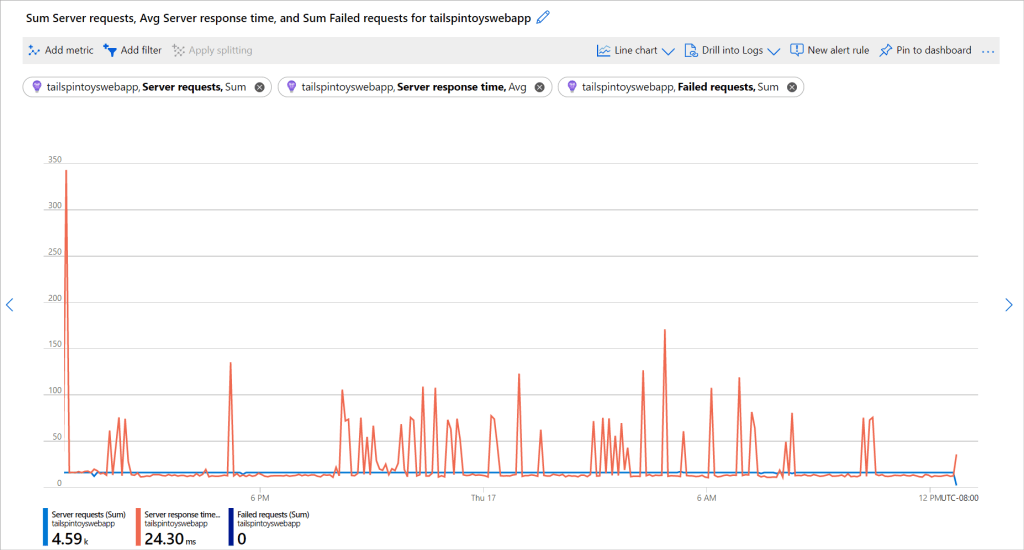
We can use Metrics Explorer to analyze the metric data and chart the values over time.
When it comes to retention,
- Platform metrics are stored for 93 days.
- Guest OS Metrics sent to Azure Monitor Metrics are stored for 93 days.
- Guest OS Metrics collected by the Log Analytics agent are stored for 31 days, and can be extended up to 2 years.
- Application Insight log-based metrics are variable and depend on the events in the underlying logs (31 days to 2 years).
You can find more details on Azure Monitor Metrics here.
Azure Monitor Logs
Azure Monitor Logs collects and organizes log and performance data from monitored resources. Log Data is stored in a structured format which can them be queried using a query language called Kusto Query Language (KQL).
Once our logs are collected, there are a number of options we have for using them, including:
- Analyze – Use Log Analytics in the Azure portal to write log queries and interactively analyze log data by using a powerful analysis engine.
- Alert – Configure a log alert rule that sends a notification or takes automated action when the results of the query match a particular result.
- Visualize –
- Pin query results rendered as tables or charts to an Azure dashboard.
- Export the results of a query to Power BI to use different visualizations and share with users outside Azure.
- Export the results of a query to Grafana to use its dashboarding and combine with other data sources.
- Get insights – Logs support insights that provide a customized monitoring experience for particular applications and services.
- Export – Configure automated export of log data to an Azure storage account or Azure Event Hubs, or build a workflow to retrieve log data and copy it to an external location by using Azure Logic Apps.
You need to create a Log Analytics Workspace in order to store the data. You can use Log Analytics Workspaces for Azure Monitor, but also to store data from other Azure services such as Sentinel or Defender for Cloud in the same workspace.
Each workspace contains multiple tables that are organized into separate columns with multiple rows of data. Each table is defined by a unique set of columns. Rows of data provided by the data source share those columns. Log queries define columns of data to retrieve and provide output to different features of Azure Monitor and other services that use workspaces.

You can the use Log Analytics to edit and run log queries and to anaylze the output. Log queries are the method of retrieving data from the Log Analytics Workspace, these are written in Kusto Query Language (KQL). You can write log queries in Log Analytics to interactively analyze their results, use them in alert rules to be proactively notified of issues, or include their results in workbooks or dashboards.
You can learn about KQL in more detail here, and find more details about Azure Monitor Logs here.
Conclusion
And thats a brief look at Azure Monitor Metric and Logs. We can see the differences between them, but how they can work together to build a powerful monitoring stack that can go right down to automating fixes for the alerts as they happen!
Hope you enjoyed this post, until next time!
