Its Day 87 of my 100 Days of Cloud journey and as promised, in todays post I’m going to install and configure Kubernetes locally using Minikube.
In the last post, we listed out all of the components that make up Kubernetes, tools used to manage the environment and also some considerations you need to be aware of when using Kubernetes.
Local Kubernetes – Minikube
We’re going to install Minikube on my Windows Laptop, however you can also install for both Linux and MacOS if thats your preference. These are the requirements to install Minikube:
2 CPUs or more
2GB of free memory
20GB of free disk space
Internet connection
Container or virtual machine manager, such as: Docker, Hyperkit, Hyper-V, KVM, Parallels, Podman, VirtualBox, or VMware Fusion/Workstation
So we download the latest stable release of Minikube from here. The installer is a simple install, and will display this screen once completed:
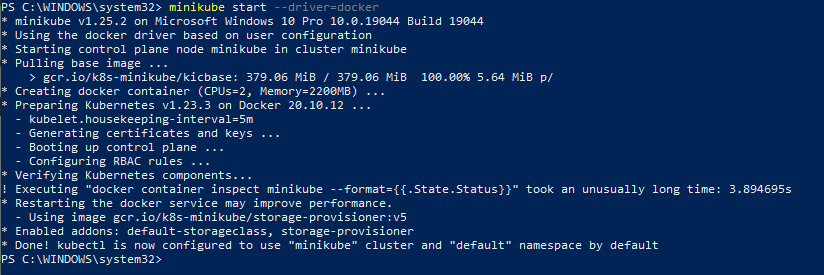
Now, we run an administrative PowerShell session, and run minikube start in order to start our cluster. Note that because I’m running on this on Windows 10, minikube automatically tried to create the cluster in Hyper-V. Therefore, I needed to run minikube start --driver=docker in order to force minikube to use docker to create the cluster.
So we can see from the output above that the cluster has been created successfully. And the eagle-eyed will also notice that we are using Kubernetes version 1.23.3, which is not the latest version. This is because Kubernetes no longer supports Docker as of version 1.24. Full support will be provided up to April 2023 for all versions up to 1.23 that run Docker. I’ve decided to base this build around Docker as I know it, but you can read more about the changes here and how they affect existing deployments here.
So we move on, and the first thing we need to do is install kubectl. You can download this directly by running minikube kubectl -- get po -A which will go off and install the appropriate version for your OS.
We can see that this has listed all of the Cluster services. We can also run minikube dashboard to launch a graphical view of all aspects of our Cluster:
Now that we’re up and running, lets do a sample webserver deployment. So we run the following commands (as we can see, the image is coming from gcr.io which is the Google Container Registry):
Now lets run kubectl get services hello-minikube to check if the deployment is running:
And if we now look in the Dashboard, we can see that the deployment is running:
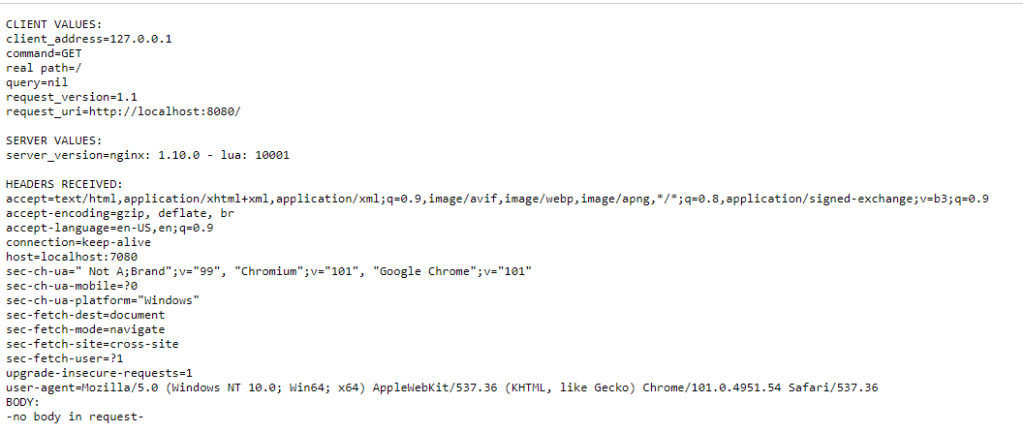
Now we can use kubectl port-forward service/hello-minikube 7080:8080 to expose the service on http://localhost:7080/, and when we browse to that we can see the metadata values returned:
And thats effectively it – your local cluster is running. You can try running another image from the Google Container Registry also, the full list of images can be found at the link here.
There are also a number of useful commands listed below that are useful to know when running minikube:
minikube pause – Pause Kubernetes without impacting deployed applications minikube unpause – Unpause a paused instance minikube stop – Halt the cluster minikube config set memory 16384 – Increase the default memory limit (requires a restart) minikube addons list – Browse the catalog of easily installed Kubernetes services minikube start -p aged --kubernetes-version=v1.16.1 – Create a second cluster running an older Kubernetes release (this is potentially useful given Docker is no longer supported) minikube delete --all – Delete all of the minikube clusters
You can find all of the information you need on Minikube including documentation and tutorials here at the official site.
Conclusion
So thats how we can run Kubernetes locally using Minikube. Slight change of plan, I’m going to do the Azure Kubernetes Service install in the next post, as we’ll go in-depth with that and look at the differences in architecture between running Kubernetes locally and in a Cloud Service.
Its Day 85 of my 100 Days of Cloud journey, and in todays post I’m looking at the options for Container Security in Azure.
Image Credit: Docker Saigon Github
We looked at an overview of Containers on Day 81, how they work like a virtual machines in that they utilize the underlying resources offered by the Container Host, but instead of packaging your code with an Operating System, each container only contains the code and dependencies needed to run the application and runs as a process inside the OS Kernel. This means that containers are smaller and more portable, and much faster to deploy and run.
We need to secure Containers in the same way as we would any other services running on the Public Cloud. Lets take a look at the different options that are available to us for securing Containers.
Use a Private registry
Containers are built from images that are stored in either public repositories such as Docker Hub, a private registry such as Docker Trusted Registry, which can be installed on-premises or in a virtual private cloud, or a cloud-based private registry such as Azure Container Registry.
Like all software that is publicly available on the internet, a publicly available container image does not guarantee security. Container images consist of multiple software layers, and each software layer might have vulnerabilities.
To help reduce the threat of attacks, you should store and retrieve images from a private registry, such as Azure Container Registry or Docker Trusted Registry. In addition to providing a managed private registry, Azure Container Registry supports service principal-based authentication through Azure Active Directory for basic authentication flows. This authentication includes role-based access for read-only (pull), write (push), and other permissions.
Ensure that only approved images are used in your environment
Allow only approved container images. Have tools and processes in place to monitor for and prevent the use of unapproved container images. One option is to control the flow of container images into your development environment. For example, you only allow a single approved Linux distribution as a base image in order to minimize the surface for potential attacks.
Another option is to utilize Azure Container Registry support for Docker’s content trust model, which allows image publishers to sign images that are pushed to a registry, and image consumers to pull only signed images.
Monitoring and Scanning Images
Use solutions that have the ability to scan container images in a private registry and identify potential vulnerabilities. Azure Container Registry optionally integrates with Microsoft Defender for Cloud to automatically scan all Linux images pushed to a registry to detect image vulnerabilities, classify them, and provide remediation guidance.
Credentials
Credential management is one of the most basic tyes of security. Because containers can spread across several clusters and Azure regions, you need to ensure that you have secure credentials required for logins or API access, such as passwords or tokens.
Using tools such as TLS encryption for secrets data in transit, least-privilege Azure role-based access control (Azure RBAC), and Azure Key Vault to securely store encryption keys and secrets (such as certificates, connection strings, and passwords) for containerized applications.
Removing unneeded privileges from Containers
You can also minimize the potential attack surface by removing any unused or unnecessary processes or privileges from the container runtime. Privileged containers run as root. If a malicious user or workload escapes in a privileged container, the container will then run as root on that system.
Enable Auditing Logging for all Container administrative user access
Use native Azure Solutions to maintain an accurate audit trail of administrative access to your container ecosystem. These logs might be necessary for auditing purposes and will be useful as forensic evidence after any security incident. Azure solutions include:
Integration of Azure Kubernetes Service with Microsoft Defender for Cloud to monitor the security configuration of the cluster environment and generate security recommendations
Azure Container Monitoring solution
Resource logs for Azure Container Instances and Azure Container Registry
Conclusion
So thats a brief overview of how we can secure containers running in Azure and ensure that we are only using approved images that have been scanned for vulnerabilities.
Its Day 82 of my 100 Days of Cloud journey, and in todays post I’m going to look at options for managing Containers in Azure.
In the last post, we looked at the comparison between Bare Metal or Physical Servers, Virtual Servers and Containers and the pros and cons of each.
We also introducted Docker, which is the best known method of managing containers using the Docker Engine and built-in Docker CLI for command management.
The one thing we didn’t show was how to install Docker or use any of the commands to manage our containers. This is because I’ve previously blogged about this and you can find all of the details as part of my series about Monitoring with Grafana and InfluxDB using Docker Containers. Part 1 shows how you can create your Docker Host running on an Ubuntu Server VM (this could also run on a Bare Metal Physical Server), and Part 2 shows the setup and configuration of Docker Containers that have been pulled from Docker Hub. So head over there and check that out, but don’t forget to come back here!
Docker Context
By default when running any Docker commands from the CLI, Docker automatically assumes that you wish to use the local Docker Host for storing and running your containers. However, you can manage multiple Docker or Kubernetes hosts or nodes by specifying contexts. A single Docker CLI can have multiple contexts. Each context contains all of the endpoint and security information required to manage a different cluster or node. The docker context command makes it easy to configure these contexts and switch between them.
In short, this means that you can manage container instances that are installed on multiple hosts and/or multiple cloud providers from a single Docker CLI.
Let take a look at the different options for managing containers in Azure.
The Docker CLI Method
In order to use containers in Azure using Docker, we first need to log on to Azure using the docker login azure command, which will prompt us for Azure credentials. Once entered, this will return “login succeeded”:
We then need to create a context by running the docker context create aci command. This will associate Docker with an Azure subscription and resource group that you can use to create and manage container instances. So we would run docker context create aci myacicontext to create a context called myacicontext.
This will select your Azure subscription ID, then prompt to select an existing resource group or create a new resource group. If you choose a new resource group, it’s created with a system-generated name. Like all Azure resources, Azure container instances must be deployed into a resource group
Once thats completed, we then run docker context use myacicontext – this ensures that any subsequent commands will run in this context. We can now use docker run to deploy containers into our Azure resource group and manage these using the Azure CLI. So lets run the following command to deploy a quickstart container runing Node.js that will give us a static website:
docker run -p 80:80 mcr.microsoft.com/azuredocs/aci-helloworld
We can now run docker ps to see the running container and get the Public IP that we can use to browse to it:
And if we log onto the Portal, we can see our running container:
So as we’ve always done, lets remember to remove the container by running docker stop sweet-chatterjee, and then docker rm sweet-chatterjee. These commands stops and deletes the Azure Container Instance:
Finally, run docker ps to ensure the container has stopped and is no longer running.
The Azure Portal Method
There are multiple ways to create and manage containers natively in Azure. We’ll look at the portal method in this post, and reference the remaining options at the end of the page.
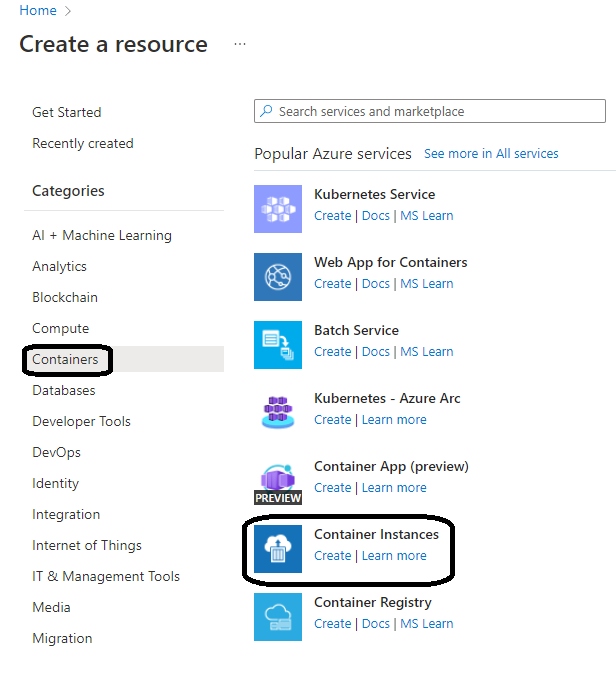
To create the container, log on to the Portal and select Container Instances from the Marketplace:
Once we select create, we are brought into the now familiar screen for creating resources in Azure:
One important thing to note on this screen is the “Image Source” option – we can select container images from either:
The quickstarts that are available in Azure.
Images stored in your Azure Container Registry.
Other registry – this can be Docker or other public or private container registry.
On the “Networking” screen, we need to specify a public DNS name for our container, and also the ports we wish to expose across the Public Internet
And once thats done, we click “Review and Create” to deploy our container:
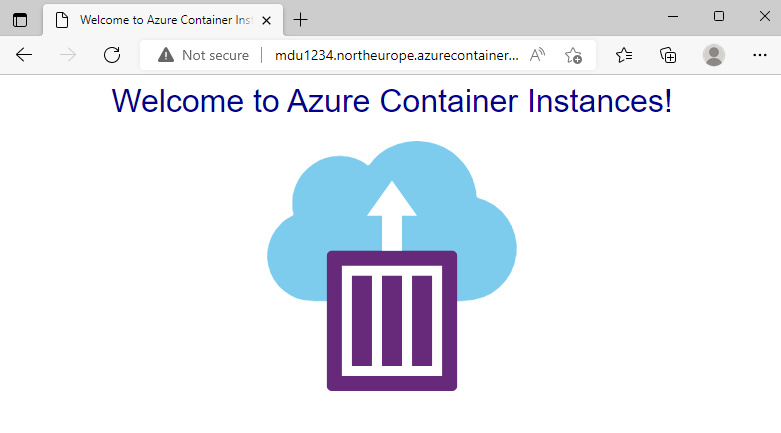
Once thats done, we can see the FQDN or Public IP that we can use to browse to the container:
As always, make sure to stop and delete the container instance once finished if you are running these in a test environment.
There are a total of four other options in Azuire for creating and managing containers:
So thats a look at how we can create and manage Azure Container Instances using both Docker CLI and the wide range of options available in Azure.
Azure Container Instances is a great solution for any scenario that can operate in isolated containers, including simple applications, task automation, and build jobs. You can find all of the documentation on Azure Container Instances here.
Its Day 81 of my 100 Days of Cloud journey, and in todays post I’m going to attempt to give an introduction to containers.
Containers. But not the sort we’re going to talk about…..
I’m building up to look at Kubernetes in later posts but as the saying goes “we need to walk before we can run”, so its important before we dive into container orchestration that we understand the fundamentals of containers.
Containers v Virtualization
Lets start with the comparison that we all make and compare the differences between containers and virtualization. Before that though, lets reverse even further into the mists of time……
Bare Metal or Physical Servers
Image Credit – Rick Vanover/Veeam Software
Back in the “good old days” (were they really that good?), you needed a Physical Server to run each one of your applications (or if you were really brave, you ran multiple applictions on a single server). These were normally large noisy beasts that took up half a rack in your datacenter. You had a single operating system per machine, and any recovery in general took time as the system needed to be rebuilt in full up to the application layer before any data recovery was performed.
Virtualization
Image Credit – Rick Vanover/Veeam Software
As processing power and capacity increased, applications running on physical servers were unable to utilise the increased resources available, which left a lot of wasted resources left unused. At this point, Virtualization enabled us to install a hypervisor which ran on the physical servers. This allowed us to create Virtual Machines that ran alongside each other on the physical hardware.
Each VM can run its own unique guest operating system, and different VMs running on the same hypervisor can run different OS versions and versions. The hypervisor assigns resources to that VM from the underlying Physical resource pool based on either static values or dynamic values which would scale up or down based on the resource demands.
The main benefits that virtualization gives:
The ability to consolidate applications onto a single system, which gave huge cost savings.
Reduced datacenter footprint.
Faster Server provisioning and improved backup and disaster recovery timelines.
In the development lifecycle, where as opposed to another monster server being purchased and configured, a VM could be quickly spun up which mirrored the Production environment and could be used for the different stages of the development process (Dev/QA/Testing etc).
There are drawbacks though, and the main ones are:
Each VM has separate OS, Memory and CPU resources assigned which adds to resource overhead and storage footprint. So all of that spare capacity we talked about above gets used very quickly.
Although we talked about the advantage of having separate environments for the development lifecycle, the portability of these applications between the different stages of the lifecycle is limited in most cases to the backup and restore method.
Containers
Image Credit – Jenny Fong/Docker
Finally, we get to the latest evolution of compute which is Containers. A container is a lightweight environment that can be used to build and securely run applications and their dependencies.
A container works like a virtual machine in that it utilizes the underlying resources offered by the Container Host, but instead of packaging your code with an Operating System, each container only contains the code and dependencies needed to run the application and runs as a process inside the OS Kernel. This means that containers are smaller and more portable, and much faster to deploy and run.
So how do I run Containers?
In On-Premise and test environments, Windows Containers ships on the majority of Windows Client and Server Operating Systems as a built-in feature that is available to use. However, for the majority of people who use containers, Docker is the platform of choice.
Docker is a containerization platform used to develop, ship, and run containers. It doesn’t use a hypervisor, and you can run Docker on your desktop or laptop if you’re developing and testing applications.
The desktop version of Docker supports Linux, Windows, and macOS. For production systems, Docker is available for server environments, including many variants of Linux and Microsoft Windows Server 2016 and above.
When you install Docker on either your Linux or Windows environment, this installs the Docker Engine which contains:
Docker client – command-line application named docker that provides us with a CLI to interact with a Docker server. The docker command uses the Docker REST API to send instructions to either a local or remote server and functions as the primary interface we use to manage our containers.
Docker server – The dockerd daemon responds to requests from the client via the Docker REST API and can interact with other daemons. The Docker server is also responsible for tracking the lifecycle of our containers.
Docker objects – there are several objects that you’ll create and configure to support your container deployments. These include networks, storage volumes, plugins, and other service objects. We’ll take a look at these in the next post when we demo the setup of Docker.
So where do I get the Containers from?
Docker provides the worlds largest respository of container images called Docker Hub. This is a public repository and contains ready made containers from both official vendors (such as WordPress, MongoDB, MariaDB, InfluxDB, Grafana, Jenkins, Tomcat, Apache Server) and also bespoke containers that have been been contributed by developers all over the world.
So there is effectively a Docker Container for every available scenario. And if you need to create one for your own scenario, you just pull the version from the Docker Hub, make your changes and push it back up to Docker Hub and mark it as public and available for use.
But what if I don’t want to store my container images in a public registry?
Thats where the Private Container Registry option comes in. Your organization or team can have access to a private registry where you can store images that are in use in your environment. This is particularly useful when you want to have version control and governance over what images you want to use in your environment.
For example, if you want to run InfluxDB and run the command to pull the InfluxDB container from the Docker Hub, by default you will get the latest stable version (which is 2.2). However, your application may need to use or only support version 1.8, so you need to specify that when pulling from the registry.
Because images are pulled from the Docker Hub by default, you need to specify the location of your Private Container Registry (in https notation) when pulling images.
There are a number of different options for where to store your Private Container Registry:
Docker Hub allows companies to host directly
Azure Container Registry
Amazon Elastic Container Registry
Google Container Registry
IBM Container Registry
Conclusion
So thats a brief overview of containers and how Docker is the proprietary software in use for managing them. In the next post, we’ll look at setting up a Docker Host machine and creating an Azure Container Registry to house our private Docker Images.
This post originally appeared on Medium on May 14th 2021
Welcome to Part 4 and the final part of my series on setting up Monitoring for your Infrastructure using Grafana and InfluxDB.
Last time, we set up InfluxDB as our Datasource for the data and metrics we’re going to use in Grafana. We also download the JSON for our Dashboard from the Grafana Dashboards Site and import this into Grafana instance. This finished off the groundwork of getting our Monitoring System built and ready for use.
In the final part, I’ll show you how to install the Telegraf Data collector agent on our WSUS Server. I’ll then configure the telgraf.conf file to query a PowerShell script, which will in turn send all collected metrics back to our InfluxDB instance. Finally, I’ll show you how to get the data from InfluxDB to display in our Dashboard.
Telegraf Install and Configuration on Windows
Telegraf is a plugin-driven server agent for collecting and sending metrics and events from databases, systems, and IoT sensors. It can be downloaded directly from the InfluxData website, and comes in version for all OS’s (OS X, Ubuntu/Debian, RHEL/CentOS, Windows). There is also a Docker image available for each version!
To download for Windows, we use the following command in Powershell:
Once the archive gets extracted, we have 2 files in the folder: telegraf.exe, and telegraf.conf:
Telegraf.exe is the Data Collector Service file and is natively supported running as a Windows Service. To install the service, run the following command from PowerShell:
This will install the Telegraf Service, as shown here under services.msc:
Telegraf.conf is the parameter file, and telegraf.conf reads that to see what metrics it needs to collect and send to the specified destination. The download I did above contains a template telegraf.conf file which will return the recommended Windows system metrics.
To test that the telgraf is working, we’ll run this command from the directory where telegraf.exe is located:
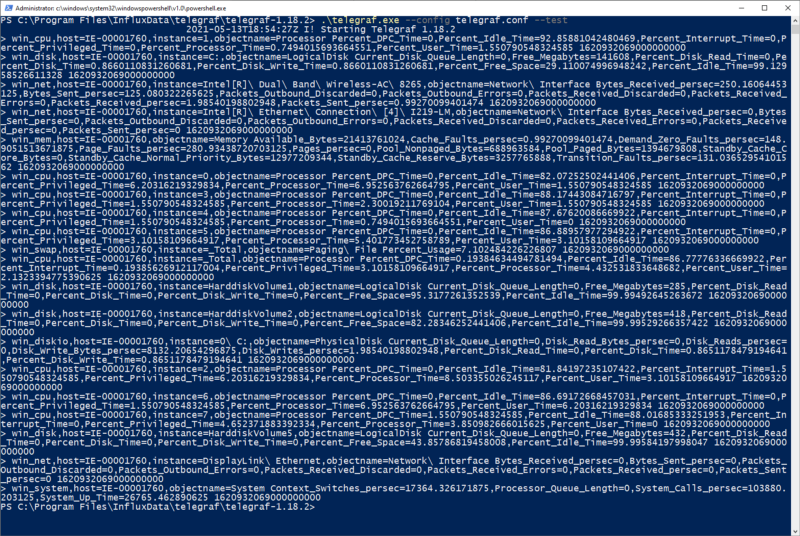
.\telegraf.exe --config telegraf.conf --test
As we can see, this is running telgraf.exe and specifying telgraf.conf as its config file. This will return this output:
This shows that telegraf can collect data from the system and is working correctly. Lets get it set up now to point at our InfluxDB. To do this, we open our telgraf.conf file and go to the [[outputs.influxdb]] section where we add this info:
This is specifying the url/port and database where we want to send the data to. This is the basic setup for telegraf.exe, next up I’ll get it working with our PowerShell script so we can send our WSUS Metrics into InfluxDB.
Using Telegraf with PowerShell
As a prerequisite, we’ll need to install the PoshWSUS Module on our WSUS Server, which can be downloaded from here.
Once this is installed, we can download our WSUS PowerShell script. The link to the script can be found here. If we look at the script, its going to do the following:
Get a count of all machines per OS Version
Get the number of updates pending for the WSUS Server
Get a count of machines that need updates, have failed updates, or need a reboot
Return all of the above data to the telegraf data collector agent, which will send it to the InfluxDB.
Before doing any integration with Telegraf, modify the script to your needs using PowerShell ISE (on line 26, you need to specify the FQDN of your own WSUS Server), and then run the script to make sure it returns the data you expect. The result will look something like this
This tells us that the script works. Now we can integrate the script into our telegraf.conf file. Underneath the “Inputs” section of the file, add the following lines:
This is telling our telegraf.exe service to call PowerShell to run our script at an interval of 300 seconds, and return the data in “influx” format.
Now once we save the changes, we can test our telegraf.conf file again to see if it returns the data from the PowerShell script as well as the default Windows metrics. Again, we run:
.\telegraf.exe --config telegraf.conf --test
And this time, we should see the WSUS results as well as the Windows Metrics:
And we do! Great, and at this point, we can now change our Telegraf Service that we installed earlier to “Running” by running this command:
net start telegraf
Now that we have this done, lets get back into Grafana and see if we can get some of this data to show in the Dashboard!
Configuring Dashboards
In the last post, we imported our blank dashboard using our json file.
Now that we have our Telegraf Agent and PowerShell script working and sending data back to InfluxDB, we can now start configuring the panels on our dashboard to show some data.
For each of the panels on our dashboard, clicking on the title at the top reveals a dropdown list of actions.
As you can see, there are a number of actions you can take (including removing a panel if you don’t need it), however we’re going to click on “Edit”. This brings us into a view where we get access to modify the properties of the Query, and also can modify some Dashboard settings including the Title and color’s to show based on the data that is being returned:
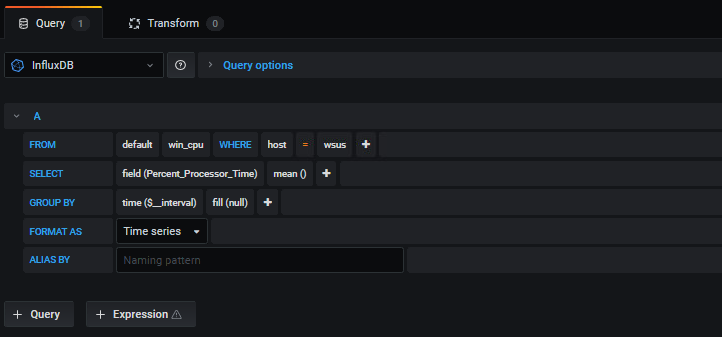
The most important thing for use in this screen is the query
As you can see, in the “FROM” portion of the query, you can change the values for “host” to match the hostname of your server. Also, from the “SELECT” portion, you can change the field() to match the data that you need to have represented on your panel. If we take a look at this field and click, it brings us a dropdown:
Remember where these values came from? These are the values that we defined in our PowerShell script above. When we select the value we want to display, we click “Apply” at the top right of the screen to save the value and return to the Main Dashboard:
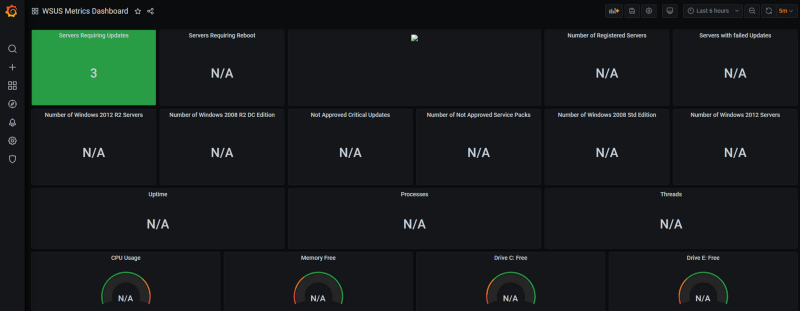
And there’s our value displayed! Lets take a look at one of the default Windows OS Metrics as well, such as CPU Usage. For this panel, you just need to select the “host” where you want the data to be displayed from:
And as we can see, its gets displayed:
There’s a bit of work to do in order to get the dashboard to display all of the values on each panel, but eventually you’ll end up with something looking like this:
As you can see, the data on the graph panels is timed (as this is a time series database), and you can adjust the times shown on the screen by using the time period selector at the top right of the Dashboard:
The final thing I’ll show you is if you have multiple Dashboards that you are looking to display on a screen, Grafana can do this by using the “Playlists” option under Dashboards.
You can also create Alerts to go to multiple sources such as Email, Teams Discord, Slack, Hangouts, PagerDuty or a webhook.
Conclusion
As you have seen over this post, Grafana is a powerful and useful tool for visualizing data. The reason for using this is conjunction with InfluxDB and Telegraf is that it had native support for Windows which was what we needed to monitor.
You can use multiple data sources (eg Prometheus, Zabbix) within the same Grafana instance depending on what data you want to visualize and display. The Grafana Dashboards site has thousands of community and official Dashboards for multiple systems such as AWS, Azure, Kubernetes etc.
While Grafana is a wonderful tool, its should be used as part of your monitoring infrastructure. Dashboards provide a great “birds-eye” view of the status of your Infrastructure, but you should use these in conjunction with other tools and processes, such as using alerts to generate tickets or self-healing alerts based on thresholds.
Thanks again for reading, I hope you have enjoyed the series and I’ll see you on the next one!
This post originally appeared on Medium on April 19th 2021
Welcome to Part 2 of my series on setting up Monitoring for your Infrastructure using Grafana and InfluxDB.
Last week as well as the series Introduction, we started our Monitoring build with Part 1, which was creating our Ubuntu Server to serve as a host for our Docker Images. Onwards we now go to Part 2, where the fun really starts and we pull our images for Grafana and InfluxDB from Docker Hub, create persistent storage and get them running.
Firstly, lets get Grafana running!
We’re going to start by going to the official Grafana Documentation (link here) which tells us that we need to create a persistent storage volume for our container. If we don’t do this, all of our data will be lost every time the container shuts down. So we run sudo docker volume create grafana-storage:
That’s created, but where is it located? Run this command to find out: sudo find / -type d -name “grafana-storage
This tells us where the file location is (in this case, the location as we can see above is:
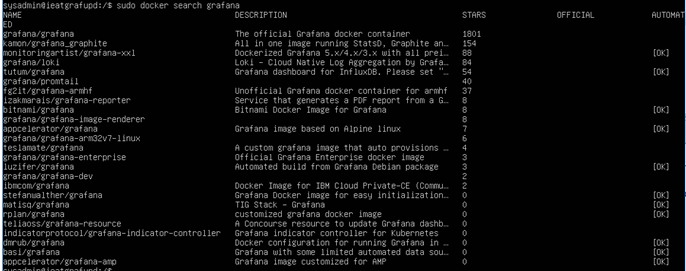
Now, we need to download the Grafana image from the docker hub. Run sudo docker search grafana to search for a list of Grafana images:
As we can see, there are a number of images available but we want to use the official one at the top of the list. So we run sudo docker pull grafana/grafana to pull the image:
This will take a few seconds to pull down. We run the sudo docker images command to confirm the image has downloaded:
Now the image is downloaded and we have our storage volume ready to persist our data. Its time to get our image running. Lets run this command:
Wow, that’s a mouthful ….. lets explain what the command is doing. We use “docker run -d” to start the container in the background. We then use the “-p 3000:3000” to make the container available on port 3000 via the IP Address of the Ubuntu Host. We then use “-v” to point at our persistent storage location that we created, and finally we use “grafana/grafana” to specify the image we want to use.
The IP of my Ubuntu Server is 10.210.239.186. Lets see if we can browse to 10.210.239.186:3000 …..
Well hello there beautiful ….. the default username/password is admin/admin, and you will be prompted to change this at first login to something more secure.
Now we need a Data Source!
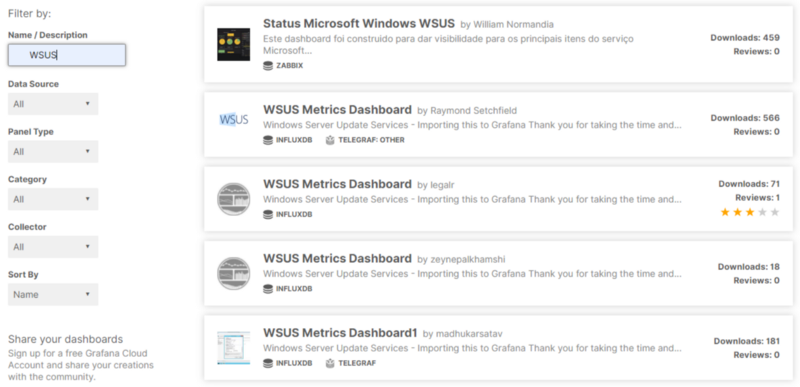
Now that we have Grafana running, we need a Data Source to store the data that we are going to present via our Dashboard. There are many excellent data sources available, the question is which one to use. That can be answered by going to the Grafana Dashboards page, where you will find thousands of Official and Community built dashboards. By searching for the Dashboard you want to create, you’ll quickly see the compatible Data Source for your desired dashboard. So if you recall, we are trying to visualize WSUS Metrics, and if we search for WSUS, we find this:
As you can see, InfluxDB is the most commonly used, so we’re going to use that. But what is this “InfluxDB” that I speak of.
InfluxDB is a “time series database”. The good people over at InfluxDB explain it a lot better than I will, but in summary a time series database is optimized for time-stamped data that can be tracked, monitored and sampled over time.
I’m going to keep using docker for hosting all elements of our monitoring solution. Lets search for the InfluxDB image on the Docker Hub by running sudo docker search influx:
Again, I’m going to use the official one, so run the sudo docker pull influxdb:1.8 command to pull the image. Note that I’m pulling the InfluxDB image with tag 1.8. Versions after 1.8 use a new DB Model which is not yet widely used:
And to confirm, lets run sudo docker images:
At this point, I’m ready to run the image. But first, lets create another persistent storage area on the host for the InfluxDB image, just like I did for the Grafana one. So we run sudo docker volume create influx18-storage:
Again, lets run the command to find it and get the exact location:
And this is what we need for our command to launch the container:
We’re running InfluxDB on port 8086 as this is its default. So now, lets check our 2 containers are running by running sudo docker ps:
OK great, so we have our 2 containers running. Now, we need to interact with the InfluxDB Container to create our database. So we run sudo docker exec -it 99ce /bin/bash:
This gives us an interactive session (docker exec -it) with the container (we’ve used the container ID “99ce” from above to identify it) so we can configure it. Finally, we’ve asked for a bash session (/bin/bash) to run commands from. So now, lets create our database and set authentication. We run “influx” and setup our database and user authentication:
Next time….
Great! So now that’s done , we need to configure InfluxDB as a Data Source for Grafana. You’ll have to wait for Part 3 for that! Thanks again for reading, and hope to see you back next week where as well as setting up our Data Source connection, we’ll set up our Dashboard in Grafana ready to receive data from our WSUS Server!
This post originally appeared on Medium on April 12th 2021
Welcome to the first part of the series where I’ll show you how to set up Monitoring for your Infrastructure using Grafana and InfluxDB. Click here for the introduction to the series.
I’m going to use Ubuntu Server 20.04 LTS as my Docker Host. For the purpose of this series, this will be installed as a VM on Hyper-V. There are a few things you need to know for the configuration:
Ubuntu can be installed as either a Gen1 or Gen2 VM on Hyper-V. For the purposes of this demo, I’ll be using Gen2.
Once the VM has been provisioned, you need to turn off Secure Boot, as shown here
Start the VM, and you will be prompted to start the install. Select “Install Ubuntu Server”:
The screen then goes black as it runs the integrity check of the ISO:
Select your language…..
…..and Keyboard layout:
Next, add your Network Information. You can also choose to “Continue without network” if you wish and set this up later in the Ubuntu OS:
You then get the option to enter a Proxy Address if you need to:
And then an Ubuntu Archive Mirror — this can be left as default:
Next, we have the Guided Storage Configuration Screen. You can choose to take up the entire disk as default, or else go for a custom storage layout. As a best practice, its better to keep your boot, swap, var and root filesystems on different partitions (an excellent description of the various options can be found here). So in this case, I’m going to pick “Custom storage layout”:
On the next screen, you need to create your volume groups for boot/swap/var/root. As shown below, I go for the following:
boot — 1GB — if Filesystems become very large (eg over 100GB), boot sometimes has problems seeing files on these larger drives.
swap — 2GB — this needs to be at least equal to the amount of RAM assigned. This is equivalent to the paging files on a Windows File System.
var — 40GB — /var contains kernel log files and also application log files.
root — whatever is left over, this should be minimum 8GB, 15GB or greater is recommended.
Once you have all of your options set up, select “Done”:
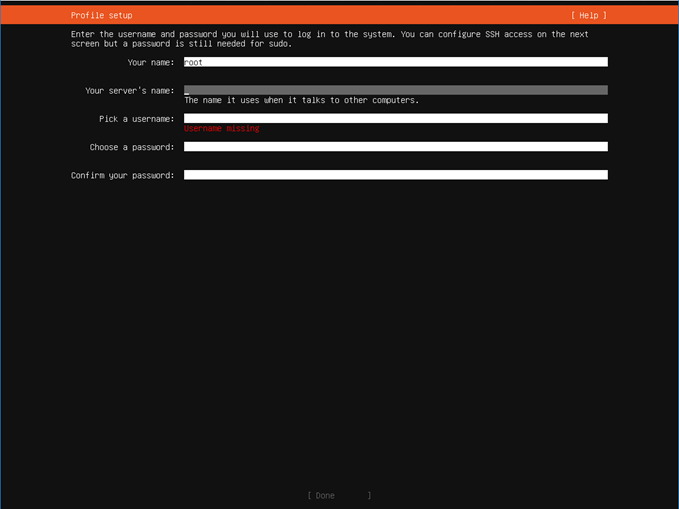
Next, you get into Profile setup screen where you set up the root username and password:
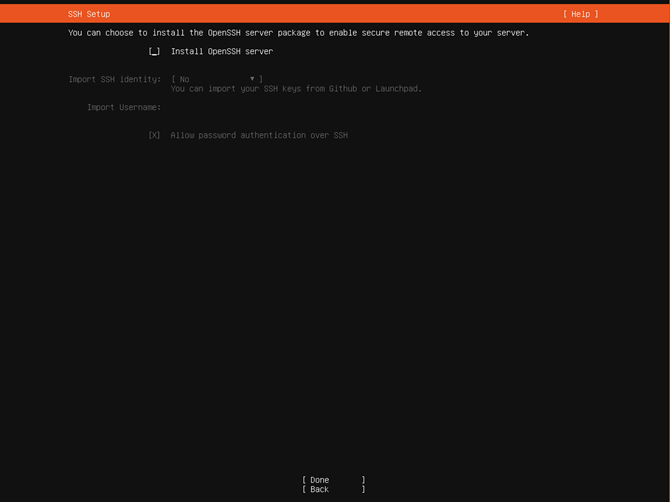
Next, you are prompted to install OpenSSH to allow remote access.
Next, we get to choose to install additional “popular” software. In this case, I’m choosing to install docker as we will need it later to run our Grafana and InfluxDB container instances:
And finally, we’re installing!! Keep looking at the top where it will say “Install Complete”. You can then reboot.
And we’re in!! As you can see, the system is telling us there are are 23 updates that can be installed:
So lets run the command “sudo apt list — upgradeable” and see what updates are available:
All looks good, so lets run the “sudo apt-get upgrade” command to upgrade all:
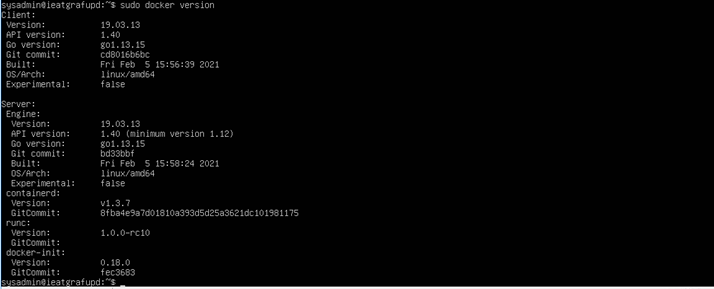
The updates will complete, and this will also install Docker as we had requested during the initial setup. Lets check to make sure its there by running “sudo docker version”:
Next Time ….
Thanks for taking the time to read this post. I’d love to hear your thoughts on this, and I hope to see you back next week when we download the Grafana and InfluxDB Docker images and configure them to run on our host.
Its Day 41 of my 100 Days of Cloud Journey, and today I’m taking Day 4 and the final session of the Cloudskills.io Linux Cloud Engineer Bootcamp
This was run live over 4 Fridays by Mike Pfieffer and the folks over at Cloudskills.io, and is focused on the following topics:
Scripting
Administration
Networking
Web Hosting
Containers
If you recall, on Day 26 I did Day 1 of the bootcamp, , Day 2 on Day 33 after coming back from my AWS studies, and Day 3 was on Day 40.
The bootcamp livestream started on November 12th and ran for 4 Fridays (with a break for Thanksgiving) before concluding on December 10th. However, you can sign up for this at any time to watch the lectures to your own pace (which I’m doing here) and get access to the Lab Exercises on demand at this link:
Week 4 was all about Containers, and Mike gave us a run through of Docker and the commands we would use to download, run and build our own Docker Images. We then looked at how this works on Azure and how we would spin up Docker Containers in Azure. The Lab exercises include exercises for doing this, and also for running containers in AWS.
The Bootcamp as a whole then concluded with Michael Dickner running though the details around Permissions in the Linux File system and how they affect and can be changed for file/folder owners, users, groups and “everyone”.
Conclusion
That’s all for this post – hope you enjoyed the Bootcamp if you did sign up – if not you can sign up at the link above! I thought it was fun – the big takeaway and most useful day for me was defintely Day 3 when looking at LAMP and MEAN stack and how to run a Web Server on Linux using OpenSource technologies.
Until next time, when we’re moving on to a new topic!