

In the previous post on AKS Identity and Access Control, we covered authentication and authorisation, Workload Identity, secrets management, and Zero Trust principles.
Your cluster is now secured! But a cluster you cannot see into is a cluster you cannot operate. In production, pods crash, nodes exhaust resources, latency spikes, and deployments fail silently. Without observability, you are reacting to outages instead of preventing them.
This post covers the full observability stack for AKS: the layers you need to monitor, the Log Analytics tables and tiers to use, the new OpenTelemetry-native ingestion path, and how AKS Automatic changes the defaults.
Observability Layers in AKS
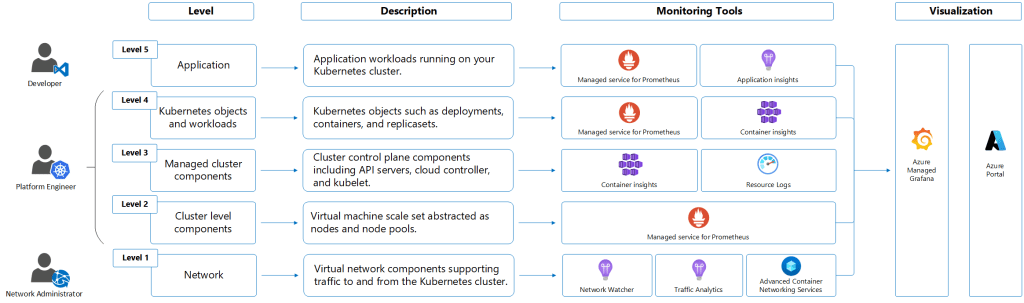
I’ve used my “Onions have Layers, Kubernetes has Layers” meme previously, but the concepts of layers in AKS and Kubernetes in general becomes more visible when it comes to monitoring because there is no “single pane of glass, one-size fits all solution”. AKS monitoring operates across multiple distinct layers, and each layer requires a different set of tools.
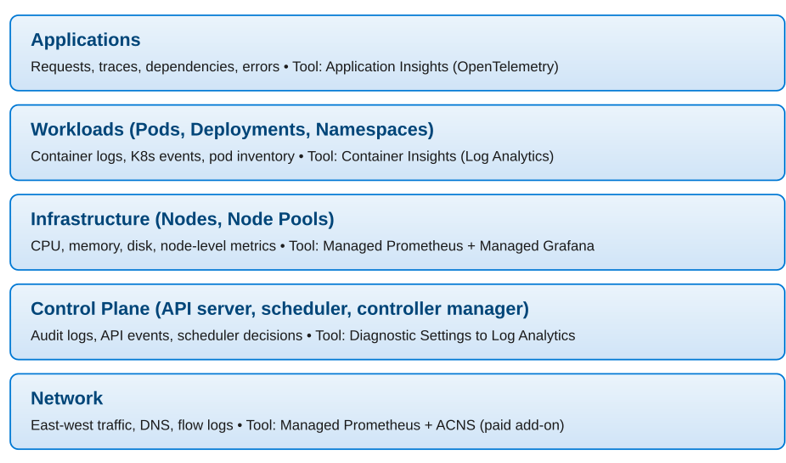
Each layer feeds into the others. A node running out of memory (Infrastructure layer) causes pod evictions (Workloads layer), which increase error rates (Applications layer). Full-stack observability means you can trace a user-facing incident from symptom to root cause across all layers.
Control Plane Logs
AKS is a managed service, so you do not have direct access to control plane nodes. Control plane activity is exposed as resource logs in Azure Monitor and enabling them is one of the first things you should do with any production cluster.
They are not collected by default. You must create a Diagnostic Setting on the cluster. Use resource-specific mode when creating the Diagnostic Setting. This routes logs to dedicated tables (AKSAudit, AKSAuditAdmin, AKSControlPlane) instead of the generic AzureDiagnostics table. Only resource-specific mode supports the Basic logs tier, which matters for cost control.
| Category | What It Contains | When to Enable |
| kube-apiserver | All API server requests and responses | When troubleshooting API-level issues |
| kube-audit | Full audit log: all API calls including GET and LIST | When you need a complete interaction trail (high volume, high cost) |
| kube-audit-admin | Audit log scoped to write operations only (create, update, delete) | Recommended for most production clusters — lower cost than kube-audit |
| kube-controller-manager | Reconciliation loops and controller activity | Troubleshooting deployment and resource issues |
| kube-scheduler | Pod scheduling decisions | Diagnosing pending pods and scheduling failures |
| cluster-autoscaler | Scale-out and scale-in events | Always recommended on clusters using autoscaling |
| guard | Entra ID and Azure RBAC authentication audit events | Always recommended when using Entra ID integration |
Infrastructure and Workload Metrics: Managed Prometheus and Grafana
Platform metrics (basic CPU, memory, and pod counts surfaced in the Azure portal) give you a starting point, but they are not enough for production operations. For real observability at the infrastructure and workload level, you need Azure Monitor Managed Service for Prometheus paired with Azure Managed Grafana.
Azure Monitor Managed Service for Prometheus
Managed Prometheus is a fully managed, Prometheus-compatible metrics service backed by an Azure Monitor workspace. It scrapes metrics from your AKS cluster using a containerized Azure Monitor agent deployed as a DaemonSet. There is no Prometheus server to deploy, scale, or maintain.
Key capabilities include:
- Write your own queries or use community dashboards
- Pre-configured recording rules and alert rules for Kubernetes deployed automatically
- Metrics retention for up to 18 months
- Native integration with Azure Managed Grafana for visualisation
- Enabled with –enable-azure-monitor-metrics at cluster creation or update
Azure Managed Grafana
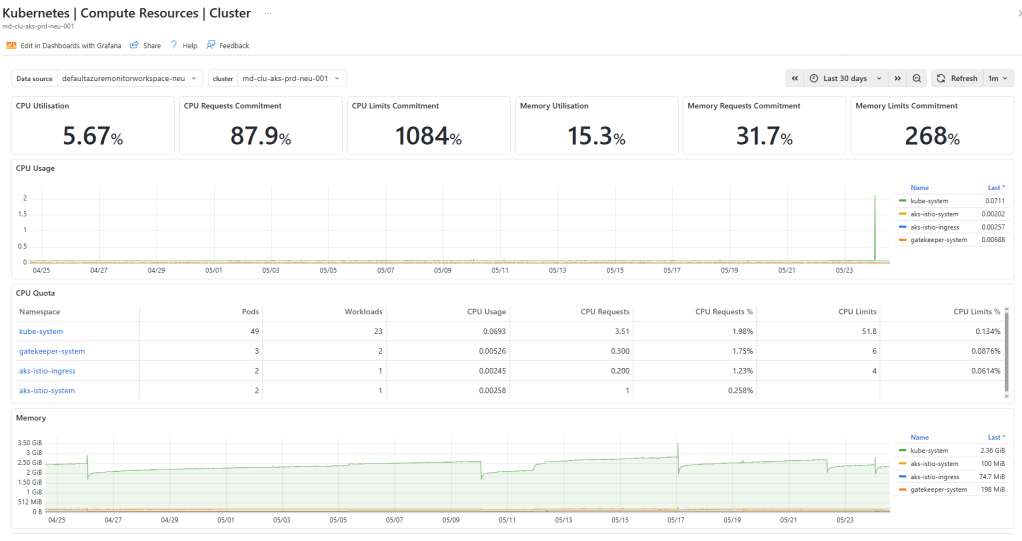
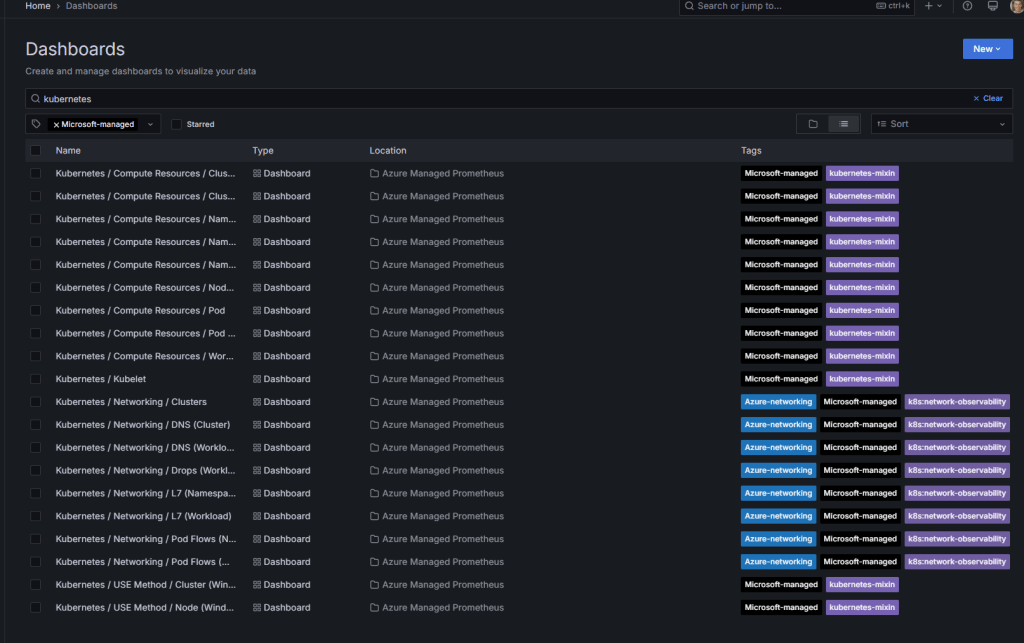
Azure Managed Grafana is a fully managed Grafana instance that connects directly to your Azure Monitor workspace as a data source. It comes pre-loaded with community Kubernetes dashboards covering node health, pod resource consumption, API server performance, and more.
You can link a Grafana workspace to your cluster at the same time you enable Prometheus metrics. A single Azure Managed Grafana instance can serve as a single pane of glass across multiple AKS clusters, all pointing at the same Azure Monitor workspace.
Container Insights: Logs, Events, and Workload Visibility
Container Insights is a feature of Azure Monitor that collects container logs, Kubernetes events, and workload inventory from your AKS cluster and stores them in a Log Analytics workspace. It is the primary tool for understanding what is happening inside your pods and namespaces.
Container Insights and Managed Prometheus work together using the same containerized Azure Monitor agent. Prometheus handles metrics, Container Insights handles logs and events.
What Container Insights Collects
- Container logs: stdout and stderr from all containers, stored in ContainerLogV2 (the recommended schema)
- Kubernetes events: pod restarts, scheduling failures, image pull errors, OOM kills
- Pod and node inventory: workload state, resource requests and limits, namespace breakdown
- Performance data: CPU and memory utilisation at node and container level
Data collection can be customised using Azure Monitor Data Collection Rules (DCRs) to control costs . You can configure collection intervals, exclude namespaces, and select specific tables to reduce ingestion volume.
| Important ContainerLogV2 is the recommended log schema for new clusters. It provides structured fields including pod name, namespace, and container name, making queries significantly easier than the legacy ContainerLog schema. |
Application-Level Observability: Application Insights
Infrastructure and workload observability tells you that a pod is crashing or a node is under pressure. Application Insights tells you why users are seeing errors — which requests are failing, where latency is concentrated, and how services are calling each other.
Application Insights is an application performance monitoring (APM) feature of Azure Monitor. For AKS workloads, there are three instrumentation approaches:
Code-Based Instrumentation with OpenTelemetry
The standard approach is to add the Azure Monitor OpenTelemetry Distro to your application code. This collects requests, dependencies, exceptions, traces, and custom metrics, sending them to an Application Insights resource.
This gives you the Application Map along with Live Metrics for real-time visibility into production traffic.
Automatic Instrumentation (Preview)
When automatic instrumentation is enabled, the Azure Monitor OpenTelemetry Distro is injected into application pods automatically with no code changes required. Instrumentation can be applied on all namespaces or per-deployment.
Native OTLP Ingestion into Azure Monitor (Preview)
This is the recent announcement, and it is a significant shift. Azure Monitor now supports native ingestion of OpenTelemetry Protocol (OTLP) signals directly.
This annoucement is meaningful for a number of reasons., but the main one is that its vendor-neutral, so applications can use the standard open-source OpenTelemetry SDK and OTLP exporter with no Azure-specific code changes or configuration required.
Network Observability
Networking is often the last layer to get proper observability, yet it is frequently the source of hard-to-diagnose issues.
When Managed Prometheus is enabled on Kubernetes 1.29 or later, basic node-level network metrics are collected by default via the Retina-based scraper, covering traffic volume and error rates.
For deeper visibility, including pod-level metrics, DNS tracking, and full flow logs, Container Network Observability (part of Advanced Container Networking Services) provides eBPF-based telemetry and writes results to ContainerNetworkLogs and RetinaNetworkFlowLogs. ACNS is a paid add-on.
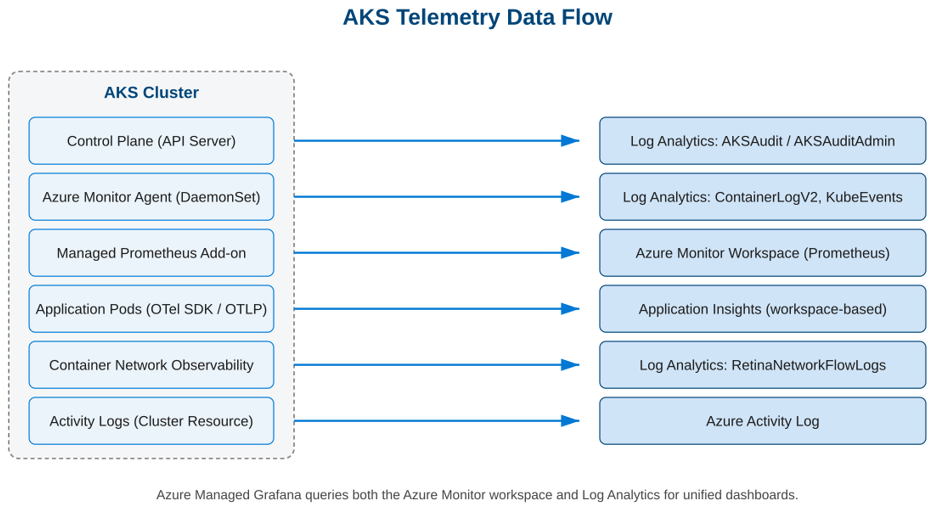
Telemetry Data Flow
And breathe! With so many tools collecting from so many sources, it helps to see the full picture:
Log Analytics Tables and Tiers
Anyone who follows me on LinkedIn (sneaky link for those who don’t!) knows that I talk a lot about FinOps and that Log Analytics is the target of a lot of my angst when it comes to Cost Management. For the sake of repeating myself, Log Analytics offers three table tiers, and the right choice for each AKS table can reduce your monitoring bill significantly.
| Tier | Ingestion Cost | Best For |
| Analytics | Standard | Frequently queried data, alerting, dashboards |
| Basic | Significant discount | Verbose logs accessed occasionally |
| Auxiliary | Lowest cost | Long-term retention, rarely queried |
When you send data to Log Analytics from any Azure resource, all tables default to the “Analytics” tier. For AKS which is a high procesing system with multiple layers which can generate a high volume of logs, you need to think about how these will be stored in Log Analytics. Below is a sample of how this should look:
| Table | Source | Tier | Why |
| AKSAudit | kube-audit | ✅ Basic | Very high volume. Compliance and investigation, not real-time alerting |
| AKSAuditAdmin | kube-audit-admin | Analytics | Write operations only. Often used for alerting and security |
| AKSControlPlane | Other control plane logs | Analytics | Operational data used for troubleshooting and alerting |
| ContainerLogV2 | Container Insights | ✅ Basic | Container stdout/stderr. Very high volume. Microsoft recommends Basic |
| KubeEvents | Container Insights | Analytics | Pod restarts, OOM kills, scheduling failures. Critical for alerting |
| KubePodInventory | Container Insights | Analytics | Powers Container Insights UI. Must be Analytics |
| RetinaNetworkFlowLogs | Container Network Observability | ✅ Basic | Switch from Analytics default for cost savings |
Alerting and Recommended Alert Rules
Collecting data is only useful if you act on it. Azure Monitor provides a set of recommended Prometheus-based alert rules for AKS that you can enable with a single action in the portal. These cover the most important cluster health signals:
- Node CPU and memory pressure
- Pod restart rates and CrashLoopBackOff detection
- Pending pods – pods that cannot be scheduled
- Job failures
- Container OOM (out of memory) kills
- PersistentVolume capacity
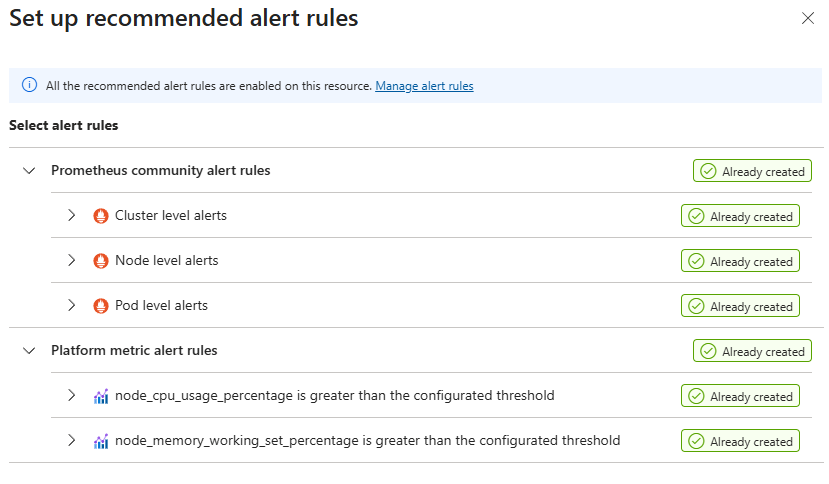
These rules are backed by Prometheus metrics and stored in your Azure Monitor workspace.
AKS Automatic: How Observability Defaults Change
Everything covered so far assumes an AKS Standard cluster, where observability is opt-in. On a fresh Standard cluster, nothing is enabled by default. AKS Automatic is different. It is a more opinionated, fully managed cluster experience where observability comes preconfigured.
| Component | AKS Standard | AKS Automatic |
| Managed Prometheus | ❌ Optional | ✅ Default at creation |
| Container Insights | ❌ Optional | ✅ Default at creation |
| ACNS Container Network Observability | ❌ Optional (paid) | ✅ Default (portal creation) |
| Managed Grafana workspace | ❌ Optional | ❌ Optional |
| Diagnostic Settings (control plane) | ❌ Optional | ❌ Optional |
| Recommended Prometheus alert rules | ❌ Optional | ❌ Optional |
The TLDR: AKS Automatic gives you a much stronger observability baseline from minute one. But control plane Diagnostic Settings (kube-audit-admin, guard) are still not on by default, and the Log Analytics tier configuration is still your responsibility.
Aligning with the Azure Well-Architected Framework
- Operational Excellence: Full-stack observability means faster to detect and faster to resolve. Prebuilt dashboards (remember, someone needs to be looking at them!) and alert rules (remember, someone needs to act on them and not just have an Outlook rule that puts them in a folder where they are ignored) reduce the time to configure baseline monitoring.
- Reliability: Alerting on node pressure, pending pods, and OOM events allows teams to respond before workloads are disrupted. Kubernetes event collection surfaces early warning signals.
- Security: kube-audit-admin and guard logs provide an audit trail for all API write operations and authentication events, supporting compliance and incident investigation.
- Cost Optimisation: Data Collection Rules allow you to control ingestion volume. Using kube-audit-admin instead of kube-audit, configuring collection intervals, and filtering namespaces can significantly reduce Log Analytics and Prometheus costs.
Conclusion
At this stage in our AKS journey we have designed the AKS architecture, networking, control plane connectivity, traffic flow, identity and access control, and now observability. The cluster is secure, well-networked, and visible.
In the next post we turn to scaling and node management — how AKS handles demand changes, how to design node pools for production workloads, and how the Cluster Autoscaler and KEDA work together to keep costs under control while maintaining availability.
See you on the next post – while you’re waiting for that you can check out the rest of the posts in the series here.

