This post originally appeared on Medium on May 14th 2021
Welcome to Part 4 and the final part of my series on setting up Monitoring for your Infrastructure using Grafana and InfluxDB.

Last time, we set up InfluxDB as our Datasource for the data and metrics we’re going to use in Grafana. We also download the JSON for our Dashboard from the Grafana Dashboards Site and import this into Grafana instance. This finished off the groundwork of getting our Monitoring System built and ready for use.
In the final part, I’ll show you how to install the Telegraf Data collector agent on our WSUS Server. I’ll then configure the telgraf.conf file to query a PowerShell script, which will in turn send all collected metrics back to our InfluxDB instance. Finally, I’ll show you how to get the data from InfluxDB to display in our Dashboard.
Telegraf Install and Configuration on Windows
Telegraf is a plugin-driven server agent for collecting and sending metrics and events from databases, systems, and IoT sensors. It can be downloaded directly from the InfluxData website, and comes in version for all OS’s (OS X, Ubuntu/Debian, RHEL/CentOS, Windows). There is also a Docker image available for each version!
To download for Windows, we use the following command in Powershell:
wget https://dl.influxdata.com/telegraf/releases/telegraf-1.18.2_windows_amd64.zip -UseBasicParsing -OutFile telegraf-1.18.2_windows_amd64.zip
This downloads the file locally, you then use this command to extract the archive to the default destination:
Expand-Archive .\telegraf-1.18.2_windows_amd64.zip -DestinationPath 'C:\Program Files\InfluxData\telegraf\'
Once the archive gets extracted, we have 2 files in the folder: telegraf.exe, and telegraf.conf:

Telegraf.exe is the Data Collector Service file and is natively supported running as a Windows Service. To install the service, run the following command from PowerShell:
C:\"Program Files"\InfluxData\Telegraf\Telegraf-1.18.2\telegraf.exe --service install
This will install the Telegraf Service, as shown here under services.msc:

Telegraf.conf is the parameter file, and telegraf.conf reads that to see what metrics it needs to collect and send to the specified destination. The download I did above contains a template telegraf.conf file which will return the recommended Windows system metrics.
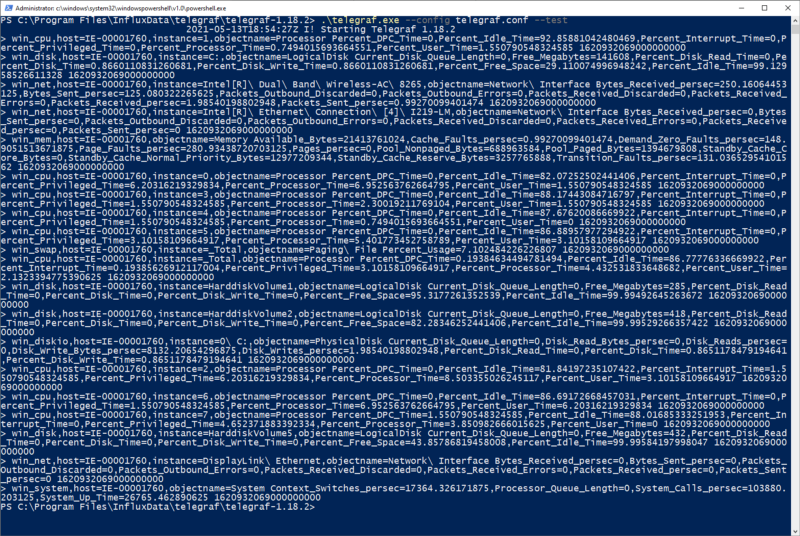
To test that the telgraf is working, we’ll run this command from the directory where telegraf.exe is located:
.\telegraf.exe --config telegraf.conf --test
As we can see, this is running telgraf.exe and specifying telgraf.conf as its config file. This will return this output:

This shows that telegraf can collect data from the system and is working correctly. Lets get it set up now to point at our InfluxDB. To do this, we open our telgraf.conf file and go to the [[outputs.influxdb]] section where we add this info:
[[outputs.influxdb]]
urls = ["http://10.210.239.186:8086"]
  database = "telegraf"
  precision = "s"
  timeout = "10s"
This is specifying the url/port and database where we want to send the data to. This is the basic setup for telegraf.exe, next up I’ll get it working with our PowerShell script so we can send our WSUS Metrics into InfluxDB.
Using Telegraf with PowerShell
As a prerequisite, we’ll need to install the PoshWSUS Module on our WSUS Server, which can be downloaded from here.
Once this is installed, we can download our WSUS PowerShell script. The link to the script can be found here. If we look at the script, its going to do the following:
- Get a count of all machines per OS Version
- Get the number of updates pending for the WSUS Server
- Get a count of machines that need updates, have failed updates, or need a reboot
- Return all of the above data to the telegraf data collector agent, which will send it to the InfluxDB.
Before doing any integration with Telegraf, modify the script to your needs using PowerShell ISE (on line 26, you need to specify the FQDN of your own WSUS Server), and then run the script to make sure it returns the data you expect. The result will look something like this

This tells us that the script works. Now we can integrate the script into our telegraf.conf file. Underneath the “Inputs” section of the file, add the following lines:
####################################################################
#                        INPUTS                                    #
####################################################################
[[inputs.exec]]
  commands = ["powershell C:/temp/wsus-stats.ps1"]
  name_override = "wsusstats"
  interval = "300s"
  timeout = "300s"
  data_format = "influx"
This is telling our telegraf.exe service to call PowerShell to run our script at an interval of 300 seconds, and return the data in “influx” format.
Now once we save the changes, we can test our telegraf.conf file again to see if it returns the data from the PowerShell script as well as the default Windows metrics. Again, we run:
.\telegraf.exe --config telegraf.conf --test
And this time, we should see the WSUS results as well as the Windows Metrics:

And we do! Great, and at this point, we can now change our Telegraf Service that we installed earlier to “Running” by running this command:
net start telegraf

Now that we have this done, lets get back into Grafana and see if we can get some of this data to show in the Dashboard!
Configuring Dashboards
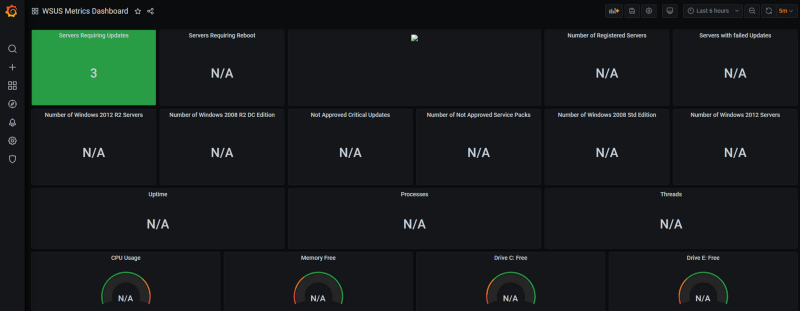
In the last post, we imported our blank dashboard using our json file.

Now that we have our Telegraf Agent and PowerShell script working and sending data back to InfluxDB, we can now start configuring the panels on our dashboard to show some data.
For each of the panels on our dashboard, clicking on the title at the top reveals a dropdown list of actions.

As you can see, there are a number of actions you can take (including removing a panel if you don’t need it), however we’re going to click on “Edit”. This brings us into a view where we get access to modify the properties of the Query, and also can modify some Dashboard settings including the Title and color’s to show based on the data that is being returned:

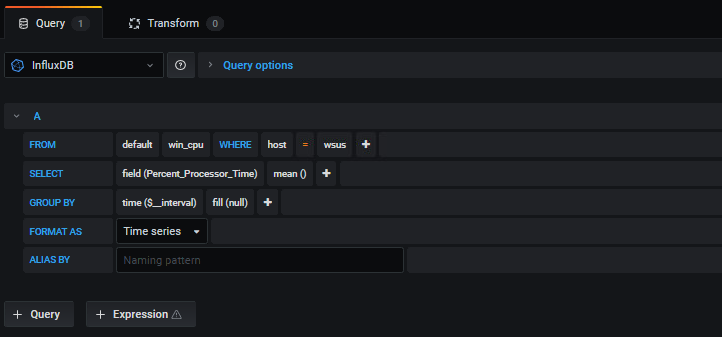
The most important thing for use in this screen is the query

As you can see, in the “FROM” portion of the query, you can change the values for “host” to match the hostname of your server. Also, from the “SELECT” portion, you can change the field() to match the data that you need to have represented on your panel. If we take a look at this field and click, it brings us a dropdown:

Remember where these values came from? These are the values that we defined in our PowerShell script above. When we select the value we want to display, we click “Apply” at the top right of the screen to save the value and return to the Main Dashboard:

And there’s our value displayed! Lets take a look at one of the default Windows OS Metrics as well, such as CPU Usage. For this panel, you just need to select the “host” where you want the data to be displayed from:

And as we can see, its gets displayed:

There’s a bit of work to do in order to get the dashboard to display all of the values on each panel, but eventually you’ll end up with something looking like this:

As you can see, the data on the graph panels is timed (as this is a time series database), and you can adjust the times shown on the screen by using the time period selector at the top right of the Dashboard:

The final thing I’ll show you is if you have multiple Dashboards that you are looking to display on a screen, Grafana can do this by using the “Playlists” option under Dashboards.

You can also create Alerts to go to multiple sources such as Email, Teams Discord, Slack, Hangouts, PagerDuty or a webhook.
Conclusion
As you have seen over this post, Grafana is a powerful and useful tool for visualizing data. The reason for using this is conjunction with InfluxDB and Telegraf is that it had native support for Windows which was what we needed to monitor.
You can use multiple data sources (eg Prometheus, Zabbix) within the same Grafana instance depending on what data you want to visualize and display. The Grafana Dashboards site has thousands of community and official Dashboards for multiple systems such as AWS, Azure, Kubernetes etc.
While Grafana is a wonderful tool, its should be used as part of your monitoring infrastructure. Dashboards provide a great “birds-eye” view of the status of your Infrastructure, but you should use these in conjunction with other tools and processes, such as using alerts to generate tickets or self-healing alerts based on thresholds.
Thanks again for reading, I hope you have enjoyed the series and I’ll see you on the next one!

2 thoughts on “Monitoring with Grafana and InfluxDB using Docker Containers — Part 4: Install and Use Telegraf with PowerShell, send data to InfluxDB, and get the Dashboard working!”