
This post originally appeared on Medium on April 12th 2021
Welcome to a series where I’ll show you how to set up Monitoring for your Infrastructure using Grafana and InfluxDB.
A little bit about Monitoring ….
Monitoring is one of the most important parts of any infrastructure setup, whether On-Premise, Hybrid or Cloud based. Not only can it help with outages, performance and security , its also used for help in design and scaling of your infrastructure.
Traditionally, monitoring systems comprise of 3 components:
- An agent to collect data from a source (this source can be an Operating System, Database, Application, Website or a piece of Hardware)
- A central database to store the data collected by all of the agents
- A website or application to visualize the data into a readable format
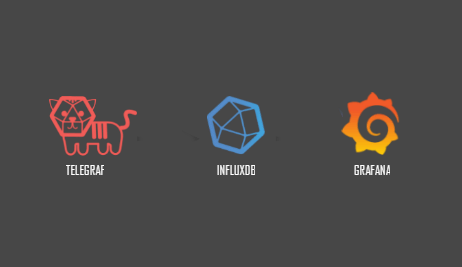
In the example shown below, the components are:
- Windows (Operating System, which is the Source)
- Telegraf (Data Collection Agent)
- InfluxDB (Time Series Database to store data sent by the Agent)
- Grafana (System to visualize the data in the database)

The Challenge
I was given a challenge to provide visualization for Microsoft Windows Server Update Services (WSUS). Anyone who uses this console knows that it hasn’t changed all that much since it was originally released way back in 2005, and any of the built in reporting leaves a lot to be desired:

Ugh …. there has to be a better way to do this …. And there is!!!
How I’ll build it!
To make things more interesting, I’m going to run Grafana and InfluxDB using Docker containers running on an Ubuntu Docker Host VM. Then we’re going to monitor a Microsoft WSUS Server with Telegraf Agent installed!
During the series, I’ll be showing you how to build the system from scratch using these steps:
- Install and setup an Ubuntu VM as a Docker Host
- Pull images from the docker registry and set them up to run using persistent storage
- Configure InfluxDB as a data source for Grafana
- Install Telegraf agent on a Windows Server and use it with a PowerShell script to send data to the Influx DB
- Configure Grafana to visualize WSUS Statistics and create alerts
Click on each of the links to go to the post — I’ll update the links as each post is released
Next time ….
Click here to go to the first step in building our Monitoring system, building our Ubuntu Docker Host
Hope you enjoyed this post, until next time!!

5 thoughts on “Monitoring with Grafana and InfluxDB using Docker Containers — Introduction”