Its Day 92 of my 100 Days of Cloud journey and in todays post we’ll continue our Demo build of an Azure Virtual Desktop environment!

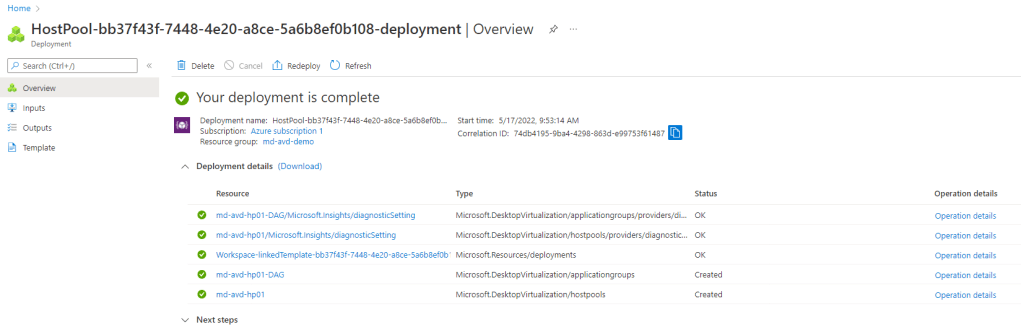
In Part 1, we got through the following tasks:
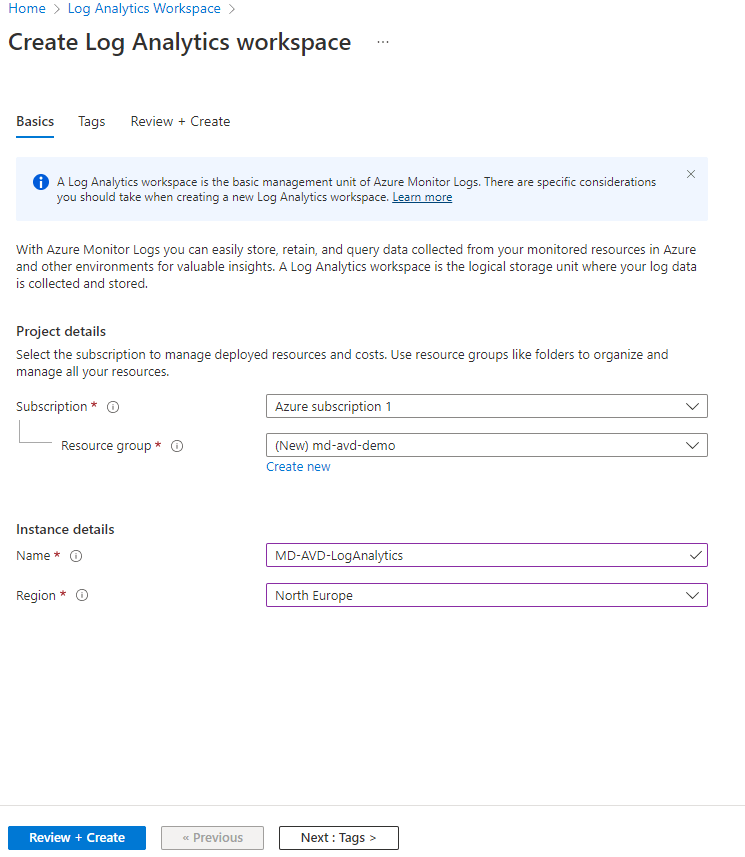
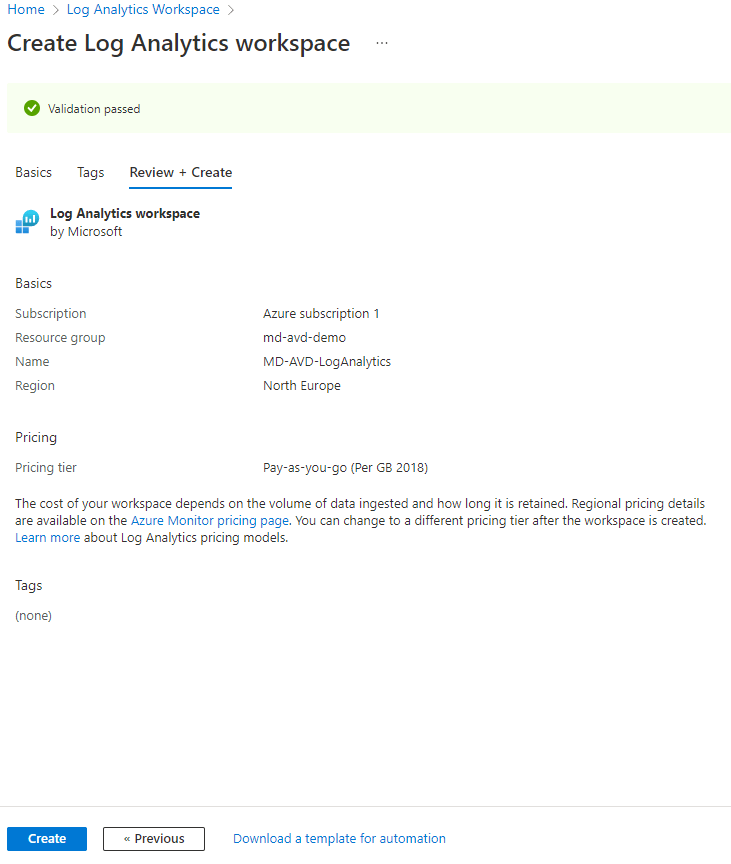
- Created our Log Analytics Workspace for logging our monitoring data
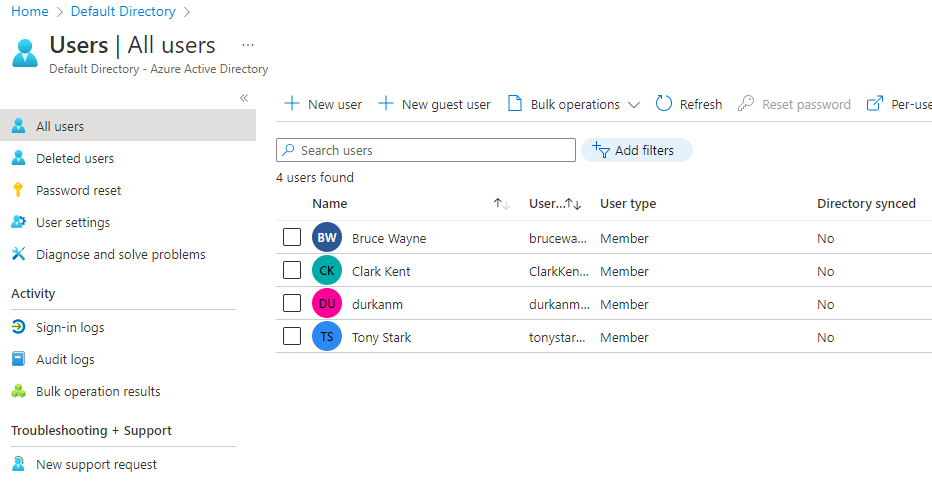
- Created our Test Users in Azure AD
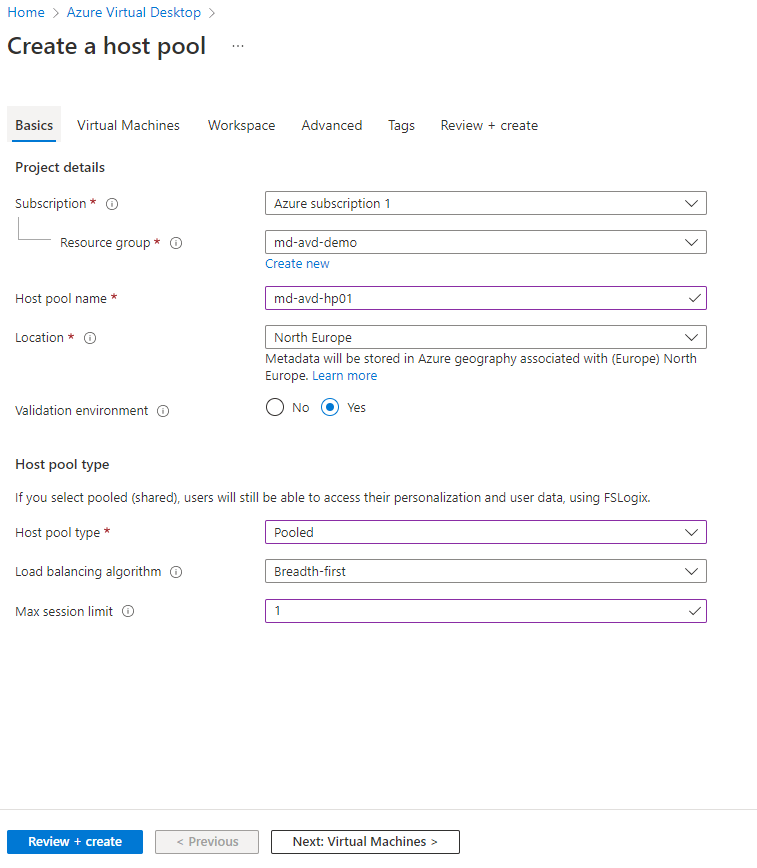
- Created the Host Pool
- Created the Assignments to allow users to access the desktops
- Created the Service Hosts
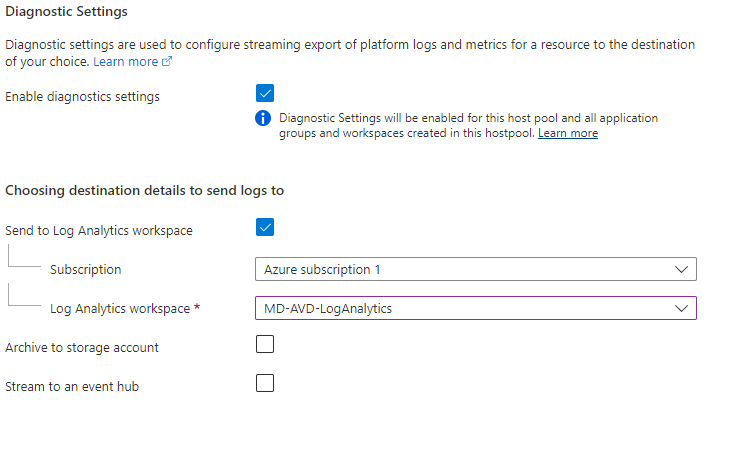
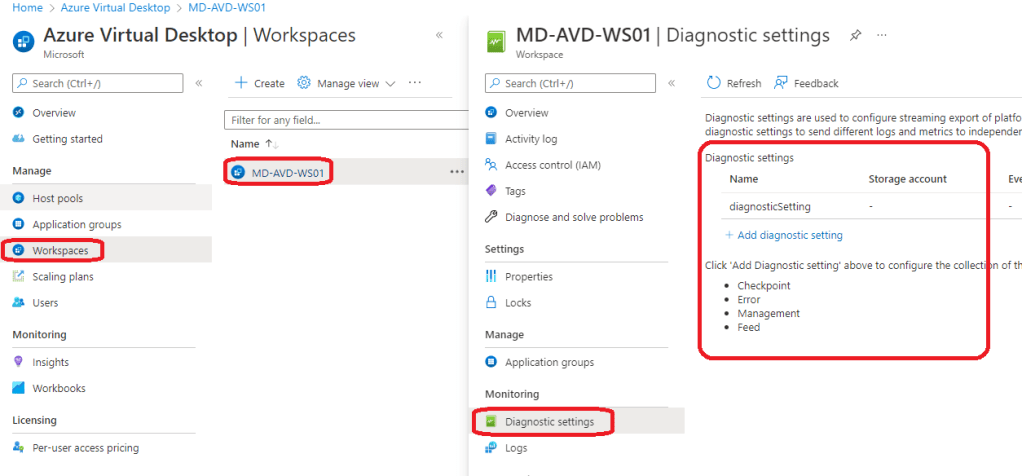
- Verified that Diagnostic Settings are working
- Added our Session Hosts into Monitoring
Lets dive back in where we left off and configure our Application Groups.
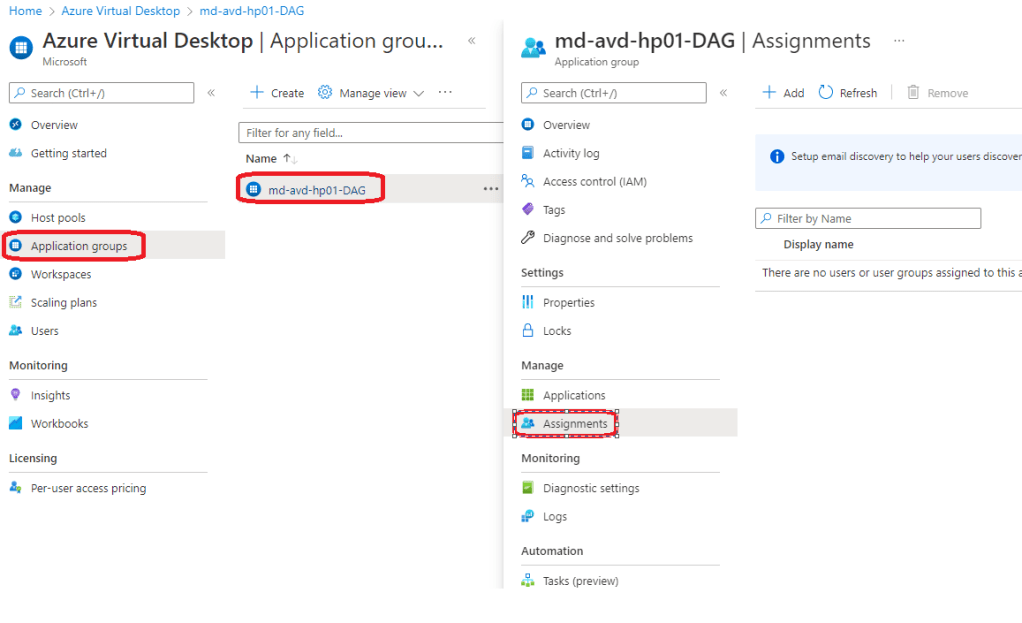
Application Groups
An Application Group is a logical grouping of applications installed on session hosts in the host pool. They are of two types:
- RemoteApp
- Desktop
An application group of type ‘Desktop’ was created automatically while creating the Session Hosts.
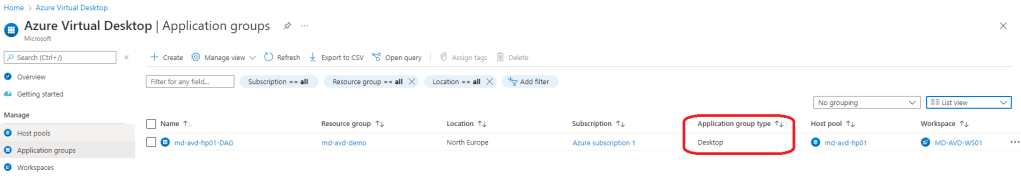
Lets check to ensure our users are assigned to the Desktop application group. To do this, we click into the Desktop Group, choose the “Assignments” option under “Manage”.
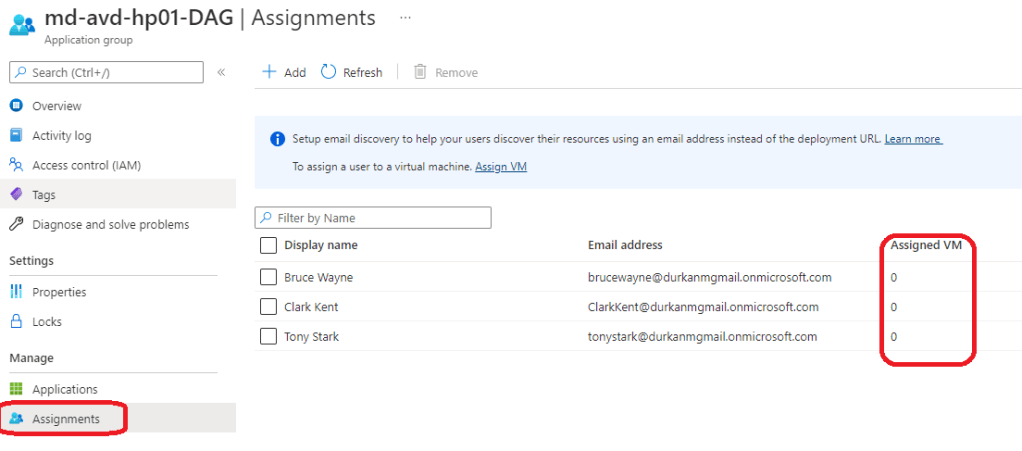
We can see that the users are assigned, but do not have an “Assigned VM”. This is because for Personal Host Pools the users will be automatically assigned a VM when they try to launch the desktop, and their user session will be load-balanced to an available session host if they haven’t already connected to the host pool. There is an option to configure direct assignment – you can find more details and commands on how to do this in the article here.
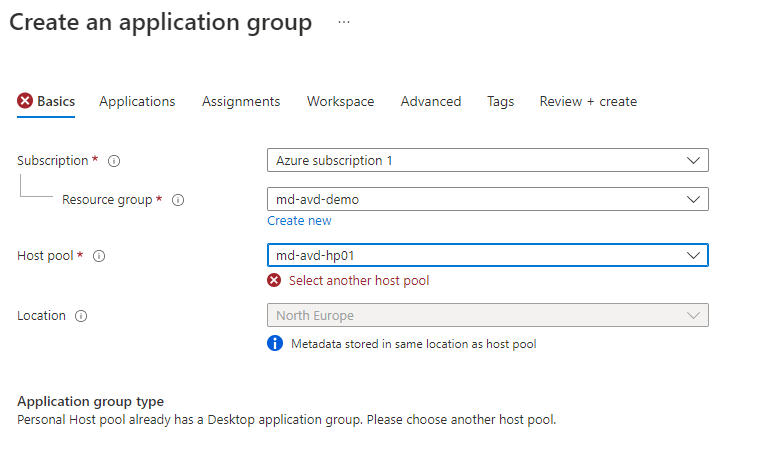
Because we are using a Personal Host Pool and alreay have a Desktop pool assigned, it means we cannot add an RemoteApp Application Group to the same host pool – if we wanted to do that we would need to either use a Pooled Host Pool or else create a new Host Pool.
We can see if we try to create a new Application Group in the same Host Pool, we get an error when we select the existing Host Pool:
The official line in the Microsoft Docs article here states:
- We don’t support assigning both the RemoteApp and desktop app groups in a single host pool to the same user. Doing so will cause a single user to have two user sessions in a single host pool. Users aren’t supposed to have two active user sessions at the same time, as this can cause the following things to happen:
- The session hosts become overloaded
- Users get stuck when trying to login
- Connections won’t work
- The screen turns black
- The application crashes
- Other negative effects on end-user experience and session performance
And this makes sense – its easier to have Desktop Sessions as part of one host pool and Application Sessions as part of another.
Lets move on to looking at the different methods for connecting our users to their Desktop Sessions.
Access the Published Desktop using Browser or Remote Desktop Client
Open the following URL in a new private mode browser tab (or incognito mode) in your own workstation/laptop. This URL will lead us to the Remote Desktop Web Client.
aka.ms/wvdarmweb
This will launch a logon screen – we’ll use the “Bruce Wayne” account to sign on:

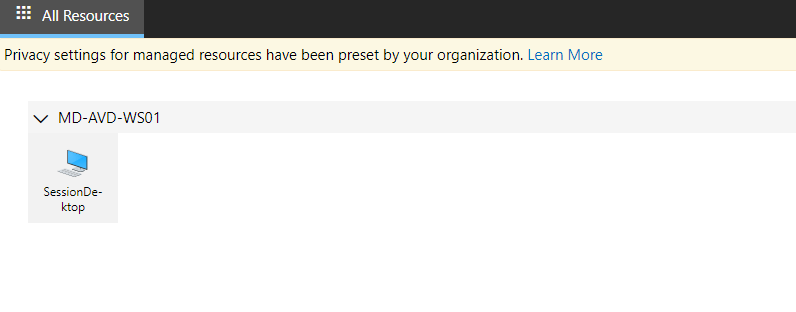
And once we get signed on, we can see our Session Desktop available:
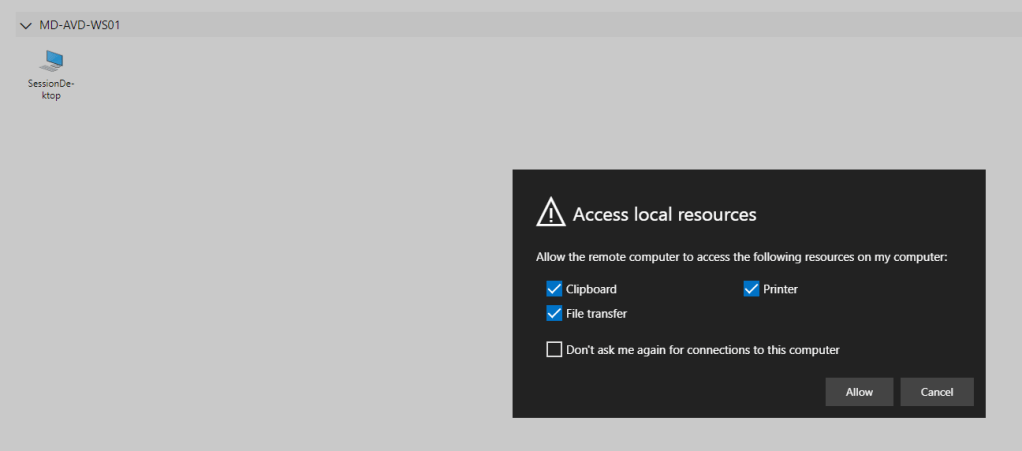
We’ll launch the session and this will ask to to allow access to local reesources. Choose your preferences here and click “Allow”
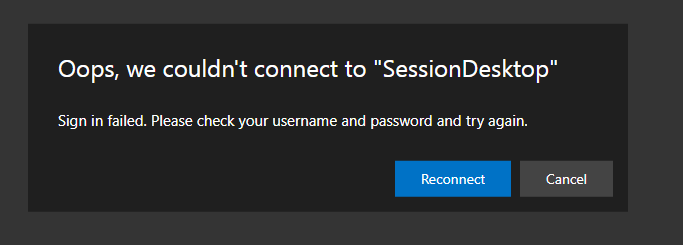
This will again ask for credentials, so we enter these and click Submit:

And it fails …..
Hmmm, why is that. Time to go off into the weeds to look into this.

So a few hours later and I’m still trying to get this working. And what I’ve found out in that time is as follows:
For Azure AD-Joined VMs, in order to access the session host the desktop you are connecting from must meet one of the following conditions:
- The local PC is Azure AD-joined to the same Azure AD tenant as the session host.
- The local PC is hybrid Azure AD-joined to the same Azure AD tenant as the session host.
- The local PC is running Windows 11 or Windows 10, version 2004 or later, and is Azure AD registered to the same Azure AD tenant as the session host.
So, this was never going to work from my local PC across the internet.
So to get around that, I spun up a new Windows 10 VM in Azure and Azure AD-joined it in the same way as my session hosts are. And tried to access my Azure Virtual Desktop pool from there…..
And it failed with the same errors……
I’ve also checked and ensured the following:
- The users are assigned the Virtual Machine User Login Role for both the Host Pool and the Resource Group where the Session Host VM’s are deployed.
- The users are assigned the Virtual Machine Administrator Login Role for both the Host Pool and the Resource Group where the Session Host VM’s are deployed.
The funny thing (if we can call it funny…) is that although Log Analytics is reporting errors with signins, everything looks to be set up correctly. Johan Vanneuville has already written an excellent article about this, and advised that signin errors can be fixed by enabling PKU2U authentication in the Local Security Policy on each VM:

Thats been checked, its enabled but its still not allowing logins.
So as a last resort, I added a Public IP Address to each of the Session Hosts and tried to RDP and logon directly to them using both Bruce and Clark’s Azure AD logins. And they can both logon over RDP, but not using Azure Virtual Desktop!
So this hasn’t worked unfortunately 😦 ….. Sorry!
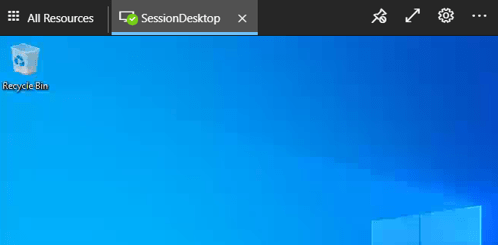
If it had, the virtual desktop would have launched and looked similar to the screenshot below:
To close off this section, I’m sure it does work, but I’m probably going to rip up the environment and start again. However, I’ve seen other threads such as this one and this one which have both included some excellent suggestions from the community, but there has yet to be a definitive answer or fix on what the issue is and how to resolve it.
Log Analytics
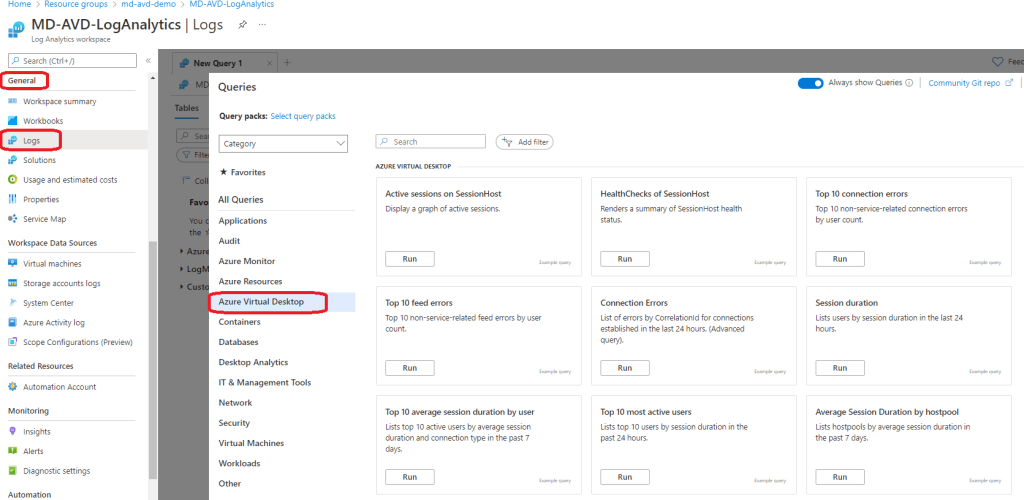
Lets close this post off by looking at Log Analytics and the data that was gathered from our Azure Virtual Desktop deployment. We’ll go to our Resource Group and click into our Log Analytics Workspace:

If we click on “Log” under the “General” menu, this gives is a splashscreen with a list of builtin queries available to run for a number of different Azure resources, and there is a full section for Azure Virtual Desktop:
If we run the “Connection Errors” query, this will paste a Kusto Query Language (KQL) query and will generate a set of results based on the query:

There are also a number of options to create alert rules based on queries or export the query results to CSV, Excel or Power BI.
Conclusion
So thats the end of this post, where we attempted (but ultimately failed for now) to get our Azure Virtual Desktop demo working. We did manage to capture all of the data in Log Analytics though, so maybe a bit more sifting through that will give the answer.
And here’s a chance for all you community memmbers to get involved – lets see if we can get this working! In the meantime, I’ll keep working on this and may rebuild the environment from scratch again to see if I’ve missed anything.
For those of you with any doubts, Azure Virtual Desktop does work! The Azure AD integration is a recent feature, and AVD is mostly deployed using synced AD DS identities.
Next time, I’ll give a run through of FSLogix and also how to create custom images for AVD.
Hope you enjoyed this post, until next time!