Monitoring with Grafana and InfluxDB using Docker Containers — Part 3: Datasource Configuration and Dashboard Installation

This post originally appeared on Medium on May 5th 2021

Welcome to Part 3 of my series on setting up Monitoring for your Infrastructure using Grafana and InfluxDB.

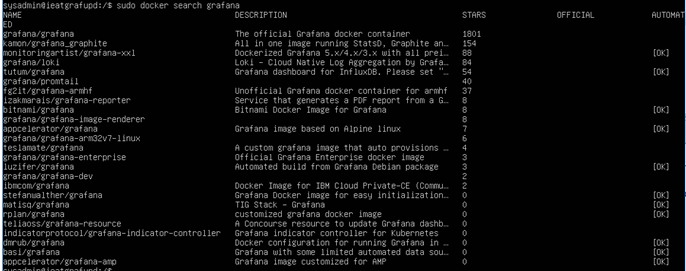
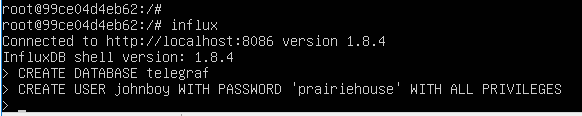
Last time, we downloaded our Docker Images for Grafana and InfluxDB, created persistent storage for them to persist our data, and also configured our initial Influx Database that will hold all of our Data.

In Part 3, we’re going to set up InfluxDB as our Datasource for the data and metrics we’re going to use in Grafana. We’ll also download the JSON for our Dashboard from the Grafana Dashboards Site and import this into Grafana instance. This will finish off the groundwork of getting our Monitoring System built and ready for use.

Configure your Data Source

  • Now we have our InfluxDB set up, we’re ready to configure it as a Data source in Grafana. So we log on to the Grafana console. Click the “Configuration” button (looks like a cog wheel) on the left hand panel, and select “Data Sources”
  • This is the main config screen for the Grafana Instance. Click on “Add data source”
  • Search for “influxdb”. Click on this and it will add it as a Data Source:
  • We are now in the screen for configuring our InfluxDB. We configure the following options:
  • Query Language — InfluxQL. (there is an option for “Flux”, however this is only used by InfluxDB versions newer than 1.8)
  • URL — this is the Address of our InfluxDB container instance. Don’t forget to specify the port as 8086.
  • Access — This will always be Server
  • Auth — No options needed here
  • Finally, we fill in our InfluxDB details:
  • Database — this is the name that we defined when setting up the database, in our case telegraf
  • User — this is our “johnboy” user
  • Password — This is the password
  • Click on “Save & Test”. This should give you a message saying that the Data source is working — this means you have a successful connection between Grafana and InfluxDB.
  • Great, so now we have a working connection between Grafana and InfluxDB

Dashboards

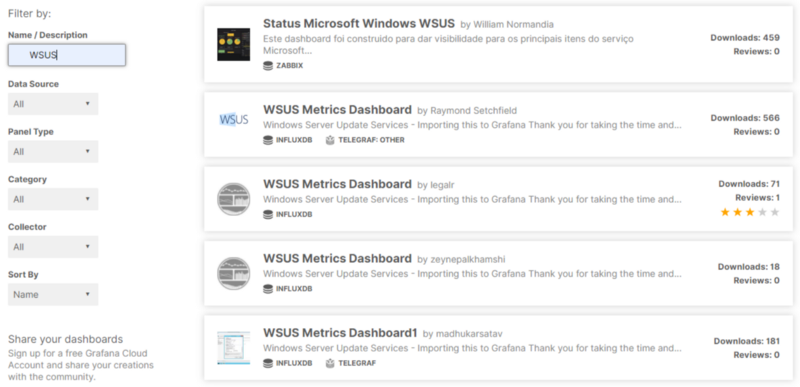
We now have our Grafana instance and our InfluxDB ready. So now we need to get some data into our InfluxDB and use this in some Dashboards. The Grafana website (https://grafana.com/grafana/dashboards) has hundreds of official and community build dashboards.

As a reminder, the challenge here is to visualize WSUS … yes, I know WSUS. As in Windows Server Update Services. Sounds pretty boring doesn’t it? It’s not really though — the problem is that unless WSUS is integrated with the likes of SCCM, SCOM or some other 3rd party tools (all of which will incur Licensing Costs), it doesn’t really have a good way of reporting and visualizing its content in a Dashboard.

  • I’ll go to the Grafana Dashboards page and search for WSUS. We can also search by Data Source.
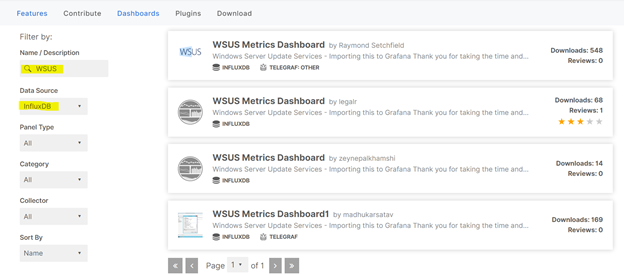
  • When we click into the first option, we can see that we can “Download JSON”
  • Once this is downloaded, lets go back to Grafana. Open Dashboards, and click “Import”:
  • Then we can click “Upload JSON File” and upload our downloaded json. We can also import directly from the Grafana website using the Dashboard ID, or else paste the JSON directly in:
  • Once the JSON is uploaded, you then get the screen below where you can rename the Dashboard, and specify what Data Source to use. Once this is done, click “Import”:
  • And now we have a Dashboard. But there’s no data! That’s the next step, we need to configure our WSUS Server to send data back to the InfluxDB.

Next time …..

Thanks again for reading! Next time will be the final part of our series, where we’ll install the Telegraf agent on our WSUS Server, use it to run a PowerShell script which will send data to our InfluxDB, and finally bring the data from InfluxDB into our Grafana Dashboard.

Hope you enjoyed this post, until next time!!

Monitoring with Grafana and InfluxDB using Docker Containers — Part 2: Docker Image Pull and Setup

This post originally appeared on Medium on April 19th 2021

Welcome to Part 2 of my series on setting up Monitoring for your Infrastructure using Grafana and InfluxDB.

Last week as well as the series Introduction, we started our Monitoring build with Part 1, which was creating our Ubuntu Server to serve as a host for our Docker Images. Onwards we now go to Part 2, where the fun really starts and we pull our images for Grafana and InfluxDB from Docker Hub, create persistent storage and get them running.

Firstly, lets get Grafana running!

We’re going to start by going to the official Grafana Documentation (link here) which tells us that we need to create a persistent storage volume for our container. If we don’t do this, all of our data will be lost every time the container shuts down. So we run sudo docker volume create grafana-storage:

  • That’s created, but where is it located? Run this command to find out: sudo find / -type d -name “grafana-storage
  • This tells us where the file location is (in this case, the location as we can see above is:

var/snap/docker/common/var-lib-docker/volumes/grafana-storage

  • Now, we need to download the Grafana image from the docker hub. Run sudo docker search grafana to search for a list of Grafana images:
  • As we can see, there are a number of images available but we want to use the official one at the top of the list. So we run sudo docker pull grafana/grafana to pull the image:
  • This will take a few seconds to pull down. We run the sudo docker images command to confirm the image has downloaded:
  • Now the image is downloaded and we have our storage volume ready to persist our data. Its time to get our image running. Lets run this command:

sudo docker run -d -p 3000:3000 — name=grafana -v grafana-storage:var/snap/docker/common/var-lib-docker/volumes/grafana-storage grafana/grafana

  • Wow, that’s a mouthful ….. lets explain what the command is doing. We use “docker run -d” to start the container in the background. We then use the “-p 3000:3000” to make the container available on port 3000 via the IP Address of the Ubuntu Host. We then use “-v” to point at our persistent storage location that we created, and finally we use “grafana/grafana” to specify the image we want to use.
  • The IP of my Ubuntu Server is 10.210.239.186. Lets see if we can browse to 10.210.239.186:3000 …..
  • Well hello there beautiful ….. the default username/password is admin/admin, and you will be prompted to change this at first login to something more secure.

Now we need a Data Source!

  • Now that we have Grafana running, we need a Data Source to store the data that we are going to present via our Dashboard. There are many excellent data sources available, the question is which one to use. That can be answered by going to the Grafana Dashboards page, where you will find thousands of Official and Community built dashboards. By searching for the Dashboard you want to create, you’ll quickly see the compatible Data Source for your desired dashboard. So if you recall, we are trying to visualize WSUS Metrics, and if we search for WSUS, we find this:
  • As you can see, InfluxDB is the most commonly used, so we’re going to use that. But what is this “InfluxDB” that I speak of.
  • InfluxDB is a “time series database”. The good people over at InfluxDB explain it a lot better than I will, but in summary a time series database is optimized for time-stamped data that can be tracked, monitored and sampled over time.
  • I’m going to keep using docker for hosting all elements of our monitoring solution. Lets search for the InfluxDB image on the Docker Hub by running sudo docker search influx:
  • Again, I’m going to use the official one, so run the sudo docker pull influxdb:1.8 command to pull the image. Note that I’m pulling the InfluxDB image with tag 1.8. Versions after 1.8 use a new DB Model which is not yet widely used:
  • And to confirm, lets run sudo docker images:
  • At this point, I’m ready to run the image. But first, lets create another persistent storage area on the host for the InfluxDB image, just like I did for the Grafana one. So we run sudo docker volume create influx18-storage:
  • Again, lets run the command to find it and get the exact location:
  • And this is what we need for our command to launch the container:

sudo docker run -d -p 8086:8086 — name=influxdb -v influx18-storage:var/snap/docker/common/var-lib-docker/volumes/influx18-storage influxdb:1.8

  • We’re running InfluxDB on port 8086 as this is its default. So now, lets check our 2 containers are running by running sudo docker ps:
  • OK great, so we have our 2 containers running. Now, we need to interact with the InfluxDB Container to create our database. So we run sudo docker exec -it 99ce /bin/bash:
  • This gives us an interactive session (docker exec -it) with the container (we’ve used the container ID “99ce” from above to identify it) so we can configure it. Finally, we’ve asked for a bash session (/bin/bash) to run commands from. So now, lets create our database and set authentication. We run “influx” and setup our database and user authentication:

Next time….

Great! So now that’s done , we need to configure InfluxDB as a Data Source for Grafana. You’ll have to wait for Part 3 for that! Thanks again for reading, and hope to see you back next week where as well as setting up our Data Source connection, we’ll set up our Dashboard in Grafana ready to receive data from our WSUS Server!

Hope you enjoyed this post, until next time!!

Monitoring with Grafana and InfluxDB using Docker Containers — Introduction

This post originally appeared on Medium on April 12th 2021

Welcome to a series where I’ll show you how to set up Monitoring for your Infrastructure using Grafana and InfluxDB.

A little bit about Monitoring ….

Monitoring is one of the most important parts of any infrastructure setup, whether On-Premise, Hybrid or Cloud based. Not only can it help with outages, performance and security , its also used for help in design and scaling of your infrastructure.

Traditionally, monitoring systems comprise of 3 components:

  • An agent to collect data from a source (this source can be an Operating System, Database, Application, Website or a piece of Hardware)
  • A central database to store the data collected by all of the agents
  • A website or application to visualize the data into a readable format

In the example shown below, the components are:

  • Windows (Operating System, which is the Source)
  • Telegraf (Data Collection Agent)
  • InfluxDB (Time Series Database to store data sent by the Agent)
  • Grafana (System to visualize the data in the database)

The Challenge

I was given a challenge to provide visualization for Microsoft Windows Server Update Services (WSUS). Anyone who uses this console knows that it hasn’t changed all that much since it was originally released way back in 2005, and any of the built in reporting leaves a lot to be desired:

Ugh …. there has to be a better way to do this …. And there is!!!

How I’ll build it!

To make things more interesting, I’m going to run Grafana and InfluxDB using Docker containers running on an Ubuntu Docker Host VM. Then we’re going to monitor a Microsoft WSUS Server with Telegraf Agent installed!

During the series, I’ll be showing you how to build the system from scratch using these steps:

Click on each of the links to go to the post — I’ll update the links as each post is released

Next time ….

Click here to go to the first step in building our Monitoring system, building our Ubuntu Docker Host

Hope you enjoyed this post, until next time!!