Its Day 53 of my 100 Days of Cloud journey, and today I’m going to deploy a Web App using Azure App Service using both manual and automated deployment methods.
In the previous post, we looked at the fundamentals of Azure App Service:
- It can use multiple programming languages to run your Web Apps or Services.
- Benefits of using App Service over on-premise hosting.
- The various App Service plans available.
- Manual or Automated deployment options using familiar tools.
- Integrate directly with multiple providers for authentication.
Manual Deployment
So with all the theory out of the way, lets dive in and deploy a Web App. We’ll start with the manual deployment method. Login to the Azure portal and open the Cloud Shell from the menu bar.

After the shell opens be sure to select the Bash environment:

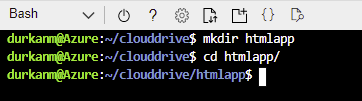
Next up, we need to create a htmlapp directory to store the files and code for our Web App:
Next, we’ll run this command in order to clone a sample Web App from the Azure Samples respository on GitHub, There are over two thousand code samples available in multiple languages, and you can browse the site here to find what you’re looking for.
git clone https://github.com/Azure-Samples/html-docs-hello-world.git

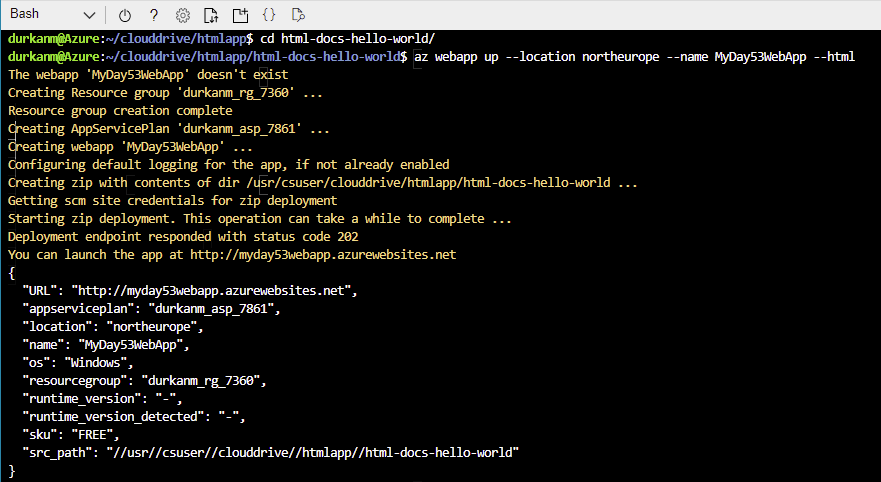
Now, change to the directory that contains the sample code and run the following command:
az webapp up --location <MyLocation> --name <MyAppName> --html
Replace <myLocation> with the Azure region that you want to deploy the Web App to, and <myAppName> with a name for your WebApp. So in my case, I’ll be running this command:
az webapp up --location northeurope --name MyDay53WebApp --html
Running this command does a number of things:
- Creates a resource group
- Creates an App Service Plan
- Creates the Web App
- Configures default logging for the app
We can see all of this info in the output from the command. We need to make a note of the Resource Group as we’ll need this later for both re-deployment and removal.
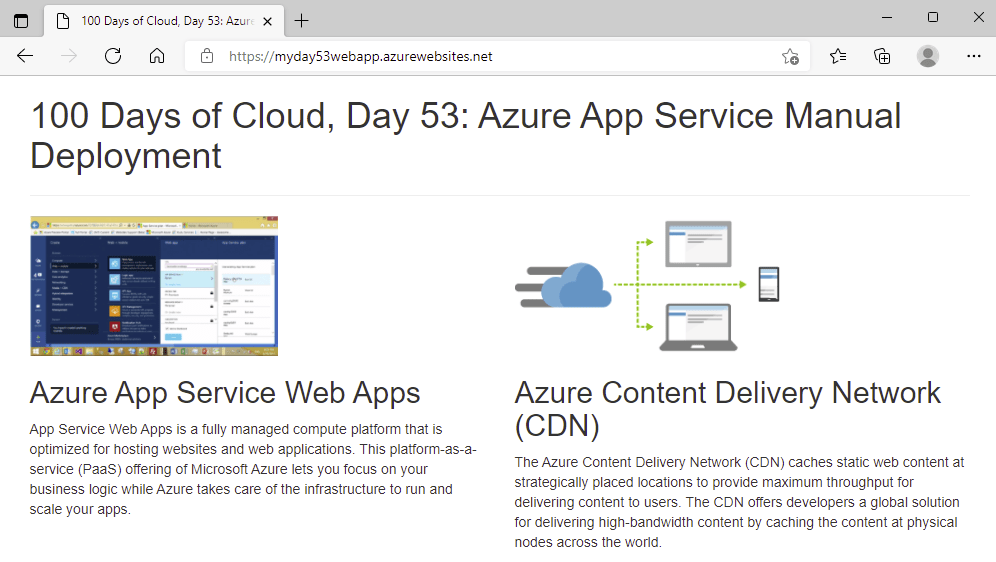
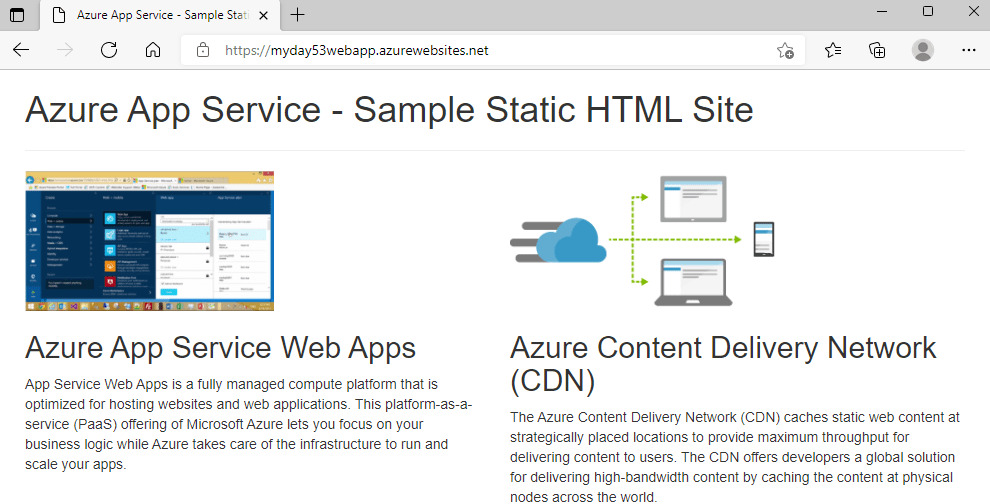
So now if we browse to the URL provided in the output:

We can see that the sample website is available. So now lets change the heading – from our bash shell we’ll run code index.html to open the editor.
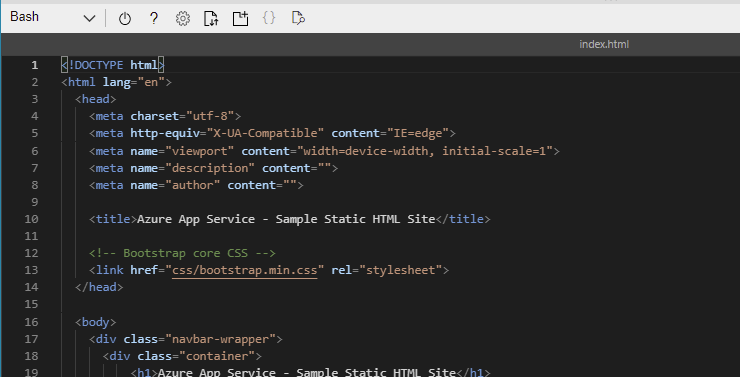
We can see in Line 10 the title that we saw when we browsed to the site, and on line 19 the header at the top of the page. Lets change this to something different:

We use ctrl-s to save and ctrl-q to quit the editor. Now, we;ll run the same command we ran earlier to redeploy the Web App:
az webapp up --location northeurope --name MyDay53WebApp --html
As we can see from the command output, it detects that the WebApp name specified already exists so will deploy the new content to this app.

And now when we refresh the page, we see that both the header and the title have changed as expected:
Automated Deployment using GitHub
So now lets take a look at one of ways to automate deployment and update of our Web App – we’ll demonstrate this using GitHub.
The first thing we need to do it locate our sample Web App respository in GitHub. Once we locate this, we’ll click on the “Fork” button:

What this does is takes a copy of the repository into our own GitHub account, so now I can see it here:

Now we can use this repository in a CI/CD Deployment model where changes to the App are pushed into production every time we make changes to the code.
So back into the Azure Portal we go, and we need to locate our existing Web App, and click on “Deployment Center”. We can see there is warning that we are in the Production Slot – this is because we are using the Free Tier for this deployment – we’ll look at deployment slots in the next post. So we start by clicking on “Source*” to select the code source, and we select “GitHub”

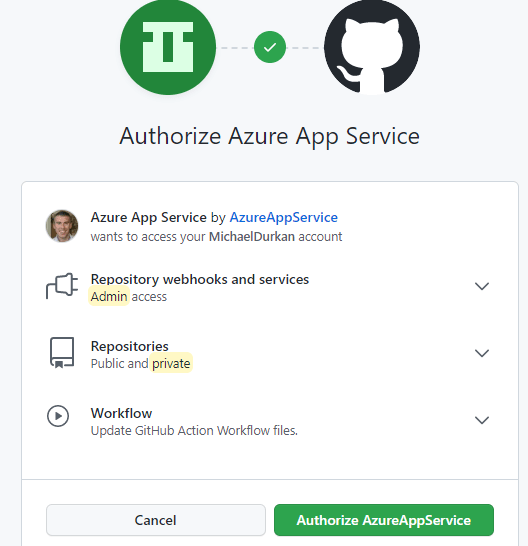
Now, we need to Authorise Github as the provider:

And now we click “Authorize App Service”
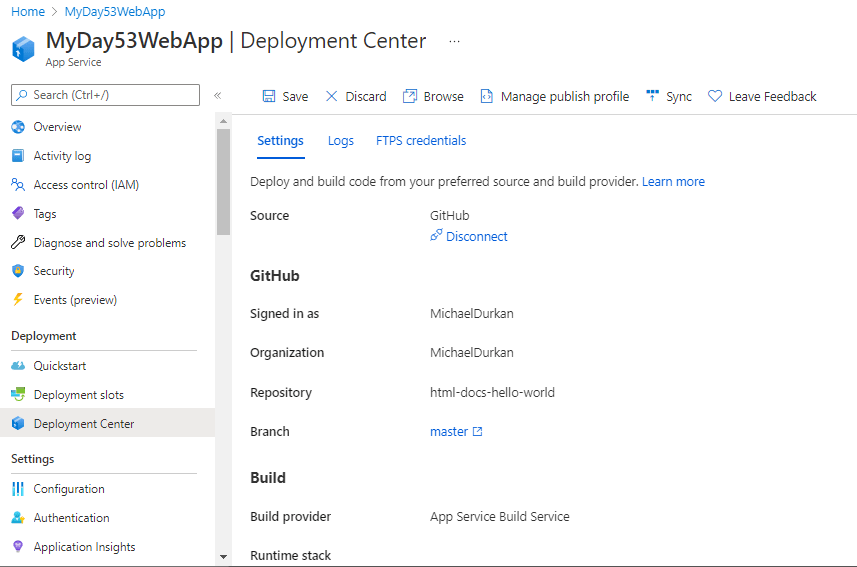
Once we’re loged into Github, we can select the Repository and Branch that we wish to use in our deployment. One thing that I changed here was the Build Provider – where we see “Building with GitHub Actions”, I changed this to “App Service Build Service”

Once all of the options are selected, click on “Save” and a page will appear confirming the settings selected:
So this is now effectively live, if we click on “Logs”, we can see that this created an update to our deployment. And because we are now using the base respository files, we can browse to the site and see we are back to the default title and heading on the site:
So now, we can edit the index.html file directly on GitHub to make changes:
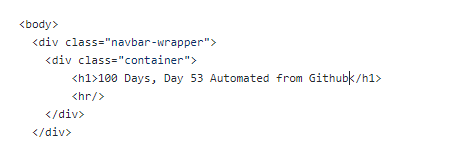
So we’ll do a commit of the changes in GitHub. And if we check our logs again, we can see another deployment has happened:
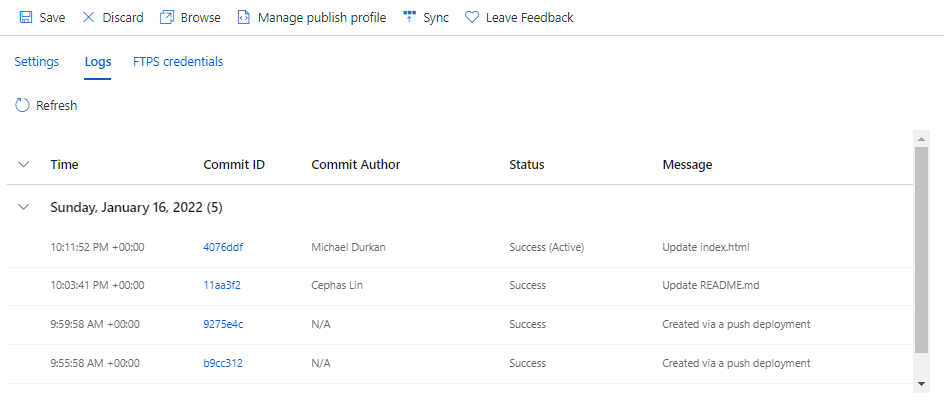
And if we refresh the website, we can see our changes automatically got published!

Conclusion
So thats an overview of deploying to Azure App Service using manual and automated deployment methods. In the next post, we’ll look at more advanced options like auto-scaling and deployment slots.
Hope you enjoyed this post, until next time!